
Algo Strategy Breakdown - Dead Ahead!
When starting to trade a new strategy, many traders wonder “how will I know if and when the strategy is broken?” The fear, completely understandable, is that the trader made some sort of mistake during development, and that without a proper feedback mechanism in place, he will not notice the system is broken until it is too late.
First things first, though. Make sure your strategy is good in the first place. Positive expectancy is key.
Many traders use a multiple of maximum historical drawdown to determine their quitting point, and unfortunately, many times they end up trading a bad system for too long. The question is: are there alternative methods to objectively determine when to stop trading a strategy? Thankfully, there are, and this article examines 2 possible methods, and compares them to a standard maximum drawdown approach.
It is frequently said that “your worst drawdown is always in the future,” and for most trading strategies that is absolutely true. Many traders anticipate this, and therefore decide to stop trading when the live trading maximum drawdown exceeds some multiple of the historical maximum drawdown. For example, if a backtest shows a maximum $10,000 drawdown, the trader might decide to stop trading at 150% of this level ($15,000 maximum drawdown), or 200% of the historical value ($20,000 maximum drawdown).
In either case, the trader succeeds in limiting his loss, hopefully before his account balance is wiped out. That is obviously key – the old adage “cut your losers short” applies not only to trades, but also to trading strategies. But before the strategy is stopped, the trader has to endure a painful drawdown. Is there a good alternative, with hopefully a smaller drawdown?
Two possible alternative quitting point methods can be found in the world of statistics and statistical process control. One is a control chart, and the other is a cumulative history chart.
Control Chart
In the world of manufacturing, process control is key. For any machine or process, to produce high quality, consistent parts, the machine must be in control. This will ensure that any parts produced are within specification. To monitor the process, quality engineers typically use a statistical process control (SPC) chart. This chart plots a key characteristic or dimension of the part in question, and alerts the machine operator of any potential issues. Such a chart is shown in Figure 1 below.
The key to a control chart is to identify problems with the machine BEFORE bad parts are produced. So, there are rules for alerting the operator to potential “out of control” problems:
Once an out of control problem is identified, the machine operator would likely take some action, such as adjusting settings on the machine, performing maintenance on the machine, etc.
In a similar manner to manufacturing, a trading system can be considered a machine. Market data is the raw material going into the machine, the strategy rules comprise the machine itself, and trade results come out of the machine – the finished part. So, for trading purposes the part dimensions shown in Figure 1 can just be replaced with individual trade results. When a strategy is thought of this way, a process control chart can become a useful tool in seeing if the machine (i.e. trading system) is broken.
Cumulative Chart
Another method of tracking if and when a strategy goes off course is thru a cumulative equity chart. For a given strategy, once the average trade and standard deviation of the strategy is known, upper and lower limits for how the strategy “should” perform can be constructed. For example, limits can be established for the upper and lower 5% curves, and can be built as follows:
Lower Bound=average-sqrt(Std Deviation)*1.645
Upper Bound=average+sqrt(Std Deviation)*1.645
Such a set of curves is shown in Figure 2. For a strategy performing normally, 90% of the time, the cumulative equity curve will be between these 2 curves. When the cumulative equity curve goes outside of the bounds, it might be time to take action with the strategy.
- One point above/below the 3 standard deviation Control Limit (denoted by square in the figure)
- Two of three successive points above/below the 2 standard deviation line (denoted by circle in the figure)
- Four of five consecutive points above/below the 1 standard deviation line (denoted by triangle in the figure)
- 8 points in a row above/below the average line (denoted by diamond in the figure)
Once an out of control problem is identified, the machine operator would likely take some action, such as adjusting settings on the machine, performing maintenance on the machine, etc.
In a similar manner to manufacturing, a trading system can be considered a machine. Market data is the raw material going into the machine, the strategy rules comprise the machine itself, and trade results come out of the machine – the finished part. So, for trading purposes the part dimensions shown in Figure 1 can just be replaced with individual trade results. When a strategy is thought of this way, a process control chart can become a useful tool in seeing if the machine (i.e. trading system) is broken.
Cumulative Chart
Another method of tracking if and when a strategy goes off course is thru a cumulative equity chart. For a given strategy, once the average trade and standard deviation of the strategy is known, upper and lower limits for how the strategy “should” perform can be constructed. For example, limits can be established for the upper and lower 5% curves, and can be built as follows:
Lower Bound=average-sqrt(Std Deviation)*1.645
Upper Bound=average+sqrt(Std Deviation)*1.645
Such a set of curves is shown in Figure 2. For a strategy performing normally, 90% of the time, the cumulative equity curve will be between these 2 curves. When the cumulative equity curve goes outside of the bounds, it might be time to take action with the strategy.
The Methods In Action
Obviously, for each of the quitting methods, the results will depend a great deal on the parameters used to define the process. For this article, the following rules were established:
Maximum Drawdown Method: Quit trading when maximum drawdown is twice the out of sample backtest maximum drawdown
Control Chart Method: Quit trading when any one of the four out of control rules is violated
Cumulative History Method: Quit trading when lower or upper bound is breached
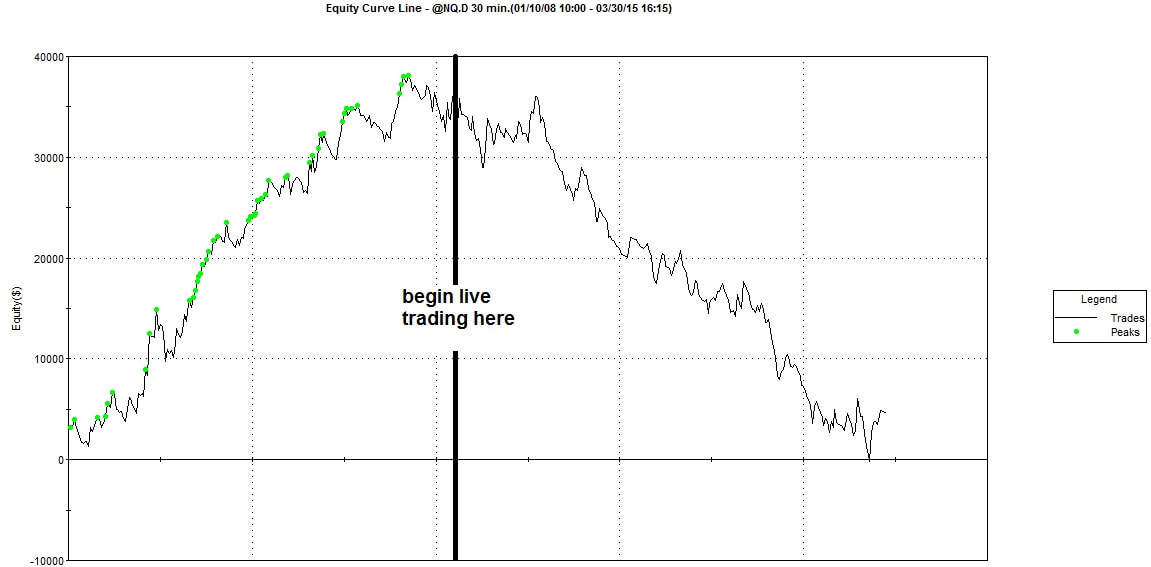
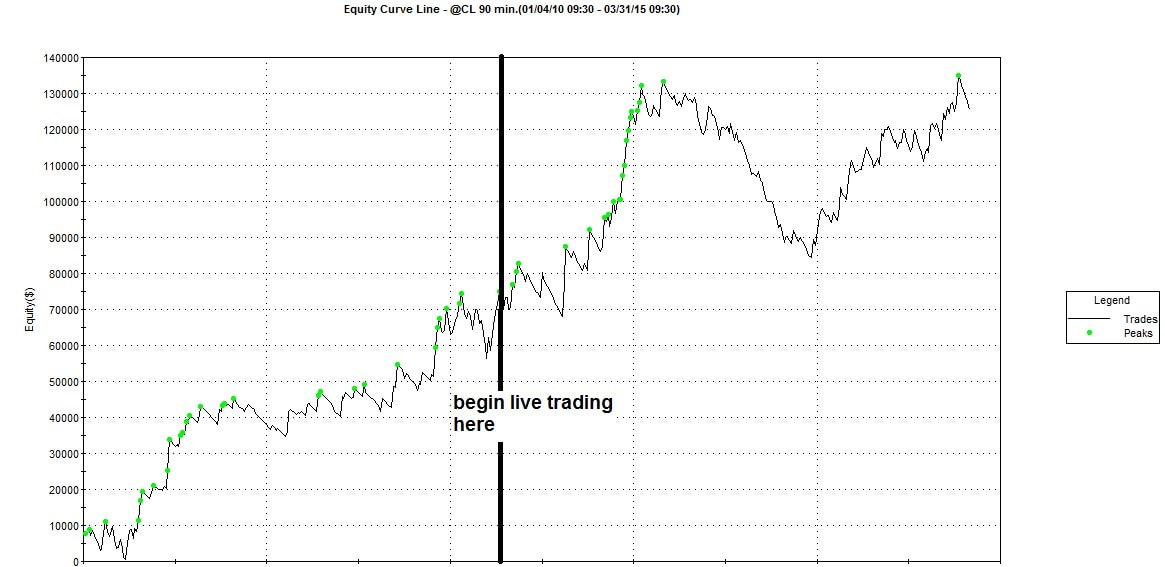
How do these methods compare for actual trading systems? Figure 3 and 4 show the equity curves for an NQ and CL trading system. The NQ system was chosen because after an initial rise, its performance deteriorated, and never recovered. Clearly, we would want to stop this system before too many trades were taken. The CL system was chosen because it suffered a major drawdown, before eventually recovering. In this case, when would each of these methods have stopped the system?
Obviously, for each of the quitting methods, the results will depend a great deal on the parameters used to define the process. For this article, the following rules were established:
Maximum Drawdown Method: Quit trading when maximum drawdown is twice the out of sample backtest maximum drawdown
Control Chart Method: Quit trading when any one of the four out of control rules is violated
Cumulative History Method: Quit trading when lower or upper bound is breached
How do these methods compare for actual trading systems? Figure 3 and 4 show the equity curves for an NQ and CL trading system. The NQ system was chosen because after an initial rise, its performance deteriorated, and never recovered. Clearly, we would want to stop this system before too many trades were taken. The CL system was chosen because it suffered a major drawdown, before eventually recovering. In this case, when would each of these methods have stopped the system?
The table below shows the results.
As shown in the table above, all three methods eventually stop trading the strategy, which is the intent. The maximum drawdown method, however, trades for a longer period of time, and ends up with a bigger net loss than the other two methods.
Although many times this will be the case, there are strategies where the maximum drawdown method will yield a better result than the control chart methods. Because of this, it might be useful to monitor a strategy with all three methods, and stop trading when any one of them produces a “stop” signal. That will be the most conservative approach.
Potential Problems
As with any mathematical technique, assumptions have to be made might have a negative impact on the analysis. For example, typical trading system results have distributions with long tails – large gains that may be more than 3 standard deviations away from the average. Plus, losses are usually capped by a stop loss or a breakeven stop loss, so the distribution on the negative side is not smooth either.
In addition, it may be typical for a trading system to have many small consecutive losses, followed by a big winning trade. While this might be perfectly acceptable to the trader, the control chart approach may flag such systems as being “out of control,” when in fact the strategy is not out of control. Therefore, care must be taken to eliminate false warnings.
The lesson here is that these techniques may have to be modified for a particular trading system, and a trained statistician may take exception to the application of these charts. But, remember the end goal is just to have an acceptable method to quit a trading system.
If the method is biased to the conservative side – turning off poorly performing strategies before things get too bad – that is probably a good thing in the long run. Certainly, it is better than the alternative – letting bad strategies drain your account.
Conclusion
Many traders, when faced with a failing trading strategy, get trapped by inaction, just as a deer freezes in front of car headlights. Of course, that is the worst thing one can do, because many times a poorly performing strategy will continue to perform poorly. A good trader needs to know when a system is broken, and when to take decisive action. This problem is made all the worse if the trader employs too much leverage.
This article has examined the pros and cons of three potential methods to quit trading a strategy: multiple of maximum drawdown, control chart and cumulative equity. While no method is perfect, and may not be appropriate in all cases, the key point is this: a good trader will determine how and when to stop a trading strategy before he begins trading. Regardless of the method, as long as his capital is preserved, the end result will be much better than letting the trading account go to zero.

About Author: Kevin Davey is an award winning private futures, forex and commodities trader. He has been trading for over 25 years.Three consecutive years, Kevin achieved over 100% annual returns in a real time, real money, year long trading contest, finishing in first or second place each of those years.
Kevin is the author of the highly acclaimed algorithmic trading book "Building Algorithmic Trading Systems: A Trader's Journey From Data Mining to Monte Carlo Simulation to Live Trading" (Wiley 2014). Kevin provides a wealth of trading information at his website: http://www.kjtradingsystems.com
Copyright, Kevin Davey and KJ Trading Systems. All Rights Reserved. Reprint of above article is permitted, as long as the About The Author information is included.