
Equity Curve Trading Myths
Most algo traders have heard the concept - turn a trading strategy on and/or off, or increase/decrease size, when the equity curve rises above or falls below a specified moving average, breaks to a certain new low (or high), or has a specified number of consecutive losing days. The fact is every trader does some sort of equity curve trading, whether they realize it or not. Once a trader makes a decision based on the equity curve, he is in effect equity curve trading.
One specific and popular method of equity curve trading deals with the use of an indicator as an overriding switch. A moving average switch on the equity curve is the most popular method. The premise is to trade only when the equity curve is above its moving average.
Of course, proponents of this equity curve trading technique typically show glowing examples, which "prove" the usefulness of the technique. But, does it really work? How do you set it up and evaluate it?
This two part article series will examine the pros and cons of equity curve trading. In the beginning of this article, we'll establish definitions and some baselines for the analysis. Later on, we'll examine equity curve trading for some real life trading systems.
NOTE: Before you embark on this analysis, make sure you have a properly developed strategy to actually test. You should find out more about building an algo system before starting this.
What is An Equity Curve?
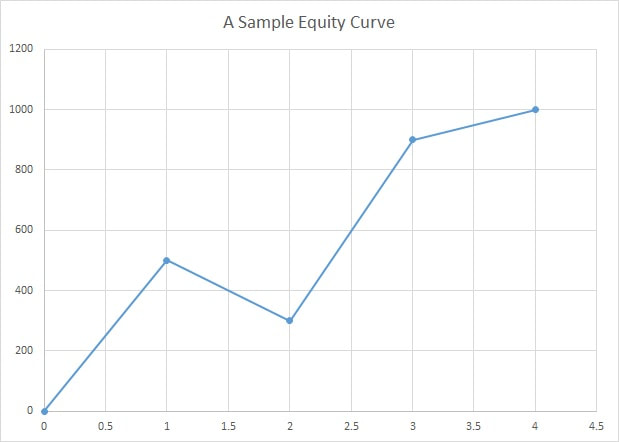
An equity curve is just a graph of the cumulative equity versus either time or number of trades. The Y axis is the cumulative equity value, and the X axis is the date or number of trades.
Here is a very simple example of an equity curve:
Let's say trade 1 is a $500 profit, trade #2 a $200 loss, trade 3 a $600 profit and trade 4 a $100 profit.
So after trade #1, the cumulative profit is $500.
After trade #2, the cumulative profit is $500-200= $300.
After trade #3, the cumulative profit is $500-200+600= $900.
After trade #4, the cumulative profit is $500-200+600+100= $1000.
This is shown in the graph below:
If you need help building an equity curve, I have a nice Equity and Drawdown Curve Calculator available for free download (near the bottom of the page).
Is Equity Curve Trading Useful?
Most algo traders have heard the concept - turn a trading strategy on and/or off, or increase/decrease size, when the equity curve rises above or falls below a specified moving average, breaks to a certain new low (or high), or has a specified number of consecutive losing days. The fact is every trader does some sort of equity curve trading, whether they realize it or not. Once a trader makes a decision based on the equity curve, he is in effect equity curve trading.
One specific and popular method of equity curve trading deals with the use of an indicator as an overriding switch. A moving average switch on the equity curve is the most popular method. The premise is to trade only when the equity curve is above its moving average.
Of course, proponents of this equity curve trading technique typically show glowing examples, which "prove" the usefulness of the technique. But, does it really work? How do you set it up and evaluate it?
This article will examine the pros and cons of equity curve trading. In the beginning of this article, we'll establish definitions and some baselines for the analysis. Later on, we'll examine equity curve trading for some real life trading systems.
NOTE: Before you embark on this analysis, make sure you have a properly developed strategy to actually test. You should find out more about building an algo system before starting this.
Evaluating The Equity Curve
In its simplest form, equity curve trading is a methodology where the strategy is turned on and off based on the characteristics of the equity curve. This is typically done by applying an indicator (such as a moving average or a breakout to the equity curve), or by employing a trigger as the switch (for example, the trigger could be turning off the strategy after X days of consecutive losses).
An example of equity curve trading is shown the figure below. In this case, the strategy is turned off when the "always on" equity curve dips below its 25 period moving average. When the "always on" equity is above the moving average curve, the strategy is allowed to take trades. Consequently, trading is allowed for the trades in blue, and trading ceases (i.e. the trader is net flat) for the red trades.
An example of equity curve trading is shown the figure below. In this case, the strategy is turned off when the "always on" equity curve dips below its 25 period moving average. When the "always on" equity is above the moving average curve, the strategy is allowed to take trades. Consequently, trading is allowed for the trades in blue, and trading ceases (i.e. the trader is net flat) for the red trades.
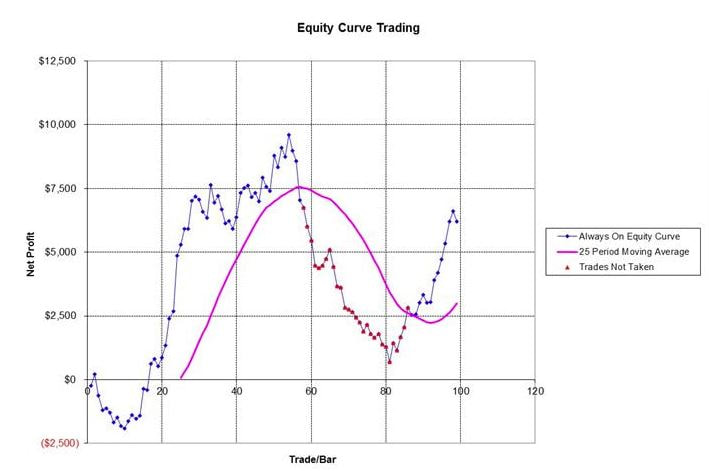
Note that after following the above rules, there is one blue trade taken below the equity curve, and one red trade taken above it. This is not an error, and actually highlights an important mistake many people make. The blue trade below the moving average is taken because the equity curve does not drop below the moving average line until AFTER the trade is completed.
Before that trade (ie, after the previous trade), the equity curve is above the moving average, which indicates that the next trade should be taken. When using an equity curve switch, one needs to be careful in making sure that trade decisions are made only with prior knowledge (ie no peeking).
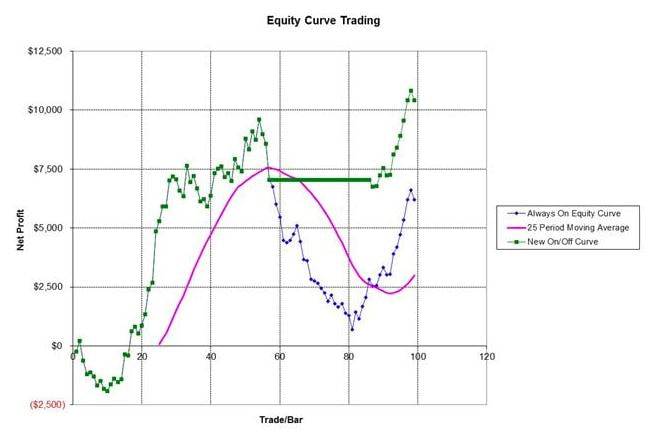
The figure below shows the net effect of this particular equity curve trading, with a comparison to the original curve. As seen in the figure, in this case the performance improves due to the equity curve technique.
Before that trade (ie, after the previous trade), the equity curve is above the moving average, which indicates that the next trade should be taken. When using an equity curve switch, one needs to be careful in making sure that trade decisions are made only with prior knowledge (ie no peeking).
The figure below shows the net effect of this particular equity curve trading, with a comparison to the original curve. As seen in the figure, in this case the performance improves due to the equity curve technique.
Of course, using a moving average calculation on an equity curve has all the disadvantages that a traditional moving average has on market price data: it has a built in lag, its performance suffers in whipsaw type situations, and the moving average can be overfit and overoptimized. So, it may be useful to look at other types of equity curve triggers.
One trigger could be a N bar breakout. In this application, the system would stop trading when an N bar low of the equity curve occurred. Trading would cease until the original equity curve turned back above the N bar low. This indicator, though, could be overoptimized by varying the value of N until a good "fit" was discovered.
Another possible trigger is to turn off the strategy after X days or trades of consecutive losses. From a psychological point of view, such an approach might have appeal for many traders. It would not work it case where consecutive losing days tend to be followed by winning days (a reversion turn the mean situation), which in fact does occur with many trading systems.
Equity curve trading can get very complicated, because just about any indicator or trigger could be applied to it. In effect, it becomes its own trading strategy, but instead of buy/sell decisions being made on the instrument price data, the decisions are made on the equity curve.
Why Can Equity Curve Trading Be Useful?
To determine if and when equity curve trading can be useful, it is instructive to look at some different possibilities for the technique's performance. This is shown below.
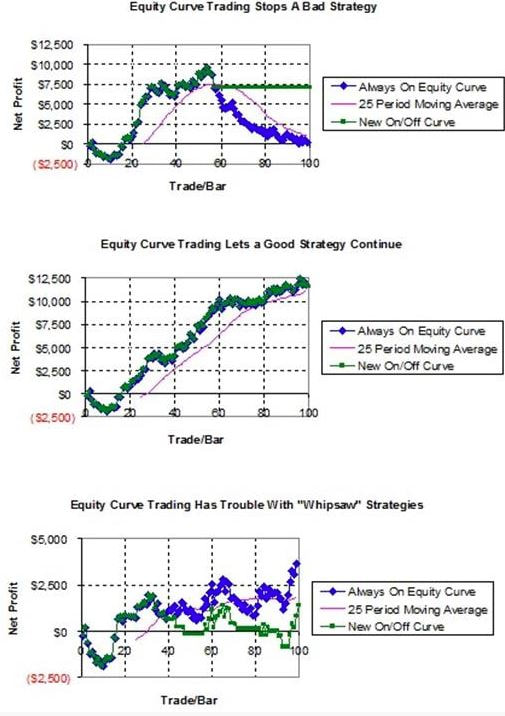
For a strategy that goes completely "bad," with its equity curve nosediving towards negative territory, the utility of equity curve trading is obvious - this technique can stop you from trading a strategy that is no longer performing at all. This is the top chart above.
For a strategy performing well, most of the time the equity curve will be above its moving average, and therefore you would continue to trade the strategy. This is also desirable - you are trading the strategy because the equity curve technique has confirmed that the strategy is doing well. This is shown in the middle chart above.
Now consider the case that is in between these two extremes. This is depicted in the bottom chart above. This strategy has times when it performs very well, times where it doesn't, and times where the equity has many whipsaws. In this case, the benefit of equity curve trading is not apparent. Sure, it stops trading when the drawdown gets severe, but it also misses out on a lot of the recovery.
How Is Equity Curve Trading Evaluated?
The best way to evaluate the equity curve trading concept is not by measuring increased profit, nor by determining the decrease in maximum drawdown. While both are important measurements, they need to be looked at simultaneously for a true evaluation. The best way, then, is to include both metrics by measuring the before and after profit/drawdown ratio.
Depending on the historical backtest trading software a trader uses, the equity curve trading switch may or may not be easy to implement. If your trading software cannot perform this analysis, it is relatively easy to create in Excel (just be careful not to peek at the data by using incorrect formulas).
Goals of Using Equity Curve Trading Switches
The goals of using an equity curve switch are really two-fold. First, the switch should turn off a poorly behaving system. Second, a properly working switch will stop trading before deep drawdowns are encountered, and will resume trading before too much profit is given away. Those are ambitious goals for a single switch.
An equity curve switch can accomplish the first goal fairly easily, especially for a poorly performing system. The table below shows that a moving average switch does a good job of turning off the system before the maximum drawdown gets too bad, regardless of length chosen. This can be reassuring to a trader, to know that a there is a clear signal from the switching method to stop trading.
Unfortunately, the second goal - improving the profit/drawdown ratio - is not so easily met. The table below shows, for a sample system, that the equity curve switch doesn’t necessarily increase the Net Profit, and in fact can make the system worse. The end result all depends on the choice of X for the moving average length.
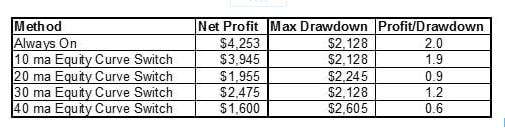
Since the moving average length X has such an impact, it should be obvious that there are some serious disadvantages with it. Trader A could use a length of 10, Trader B could use a length of 20, and they will have dramatically different results. Of course, that leads many traders to state "well, I'll just optimize it." But, just like optimizing parameters in a trading system, optimizing the parameter of an equity curve switch is fraught with peril, prone to every type of bias and overfitting.
Equity curve switching is a popular technique, but it is unclear as to whether it is really beneficial. For decidedly excellent trading systems, and poor performing systems, the approach can be useful. For trading systems in the middle, which comprise the lion's share of systems, the benefits are not so clear.
Equity curve switching is a popular technique, but it is unclear as to whether it is really beneficial. For decidedly excellent trading systems, and poor performing systems, the approach can be useful. For trading systems in the middle, which comprise the lion's share of systems, the benefits are not so clear.
Equity Curve Myths
Earlier we looked at the concept of equity curve trading. As a refresher, equity curve trading is simply a methodology where a trading strategy is turned on and off based on the gyrations of the equity curve. While there are many different approaches to employing equity curve trading, the idea is straightforward: trade strategies when they are making money, and temporarily turn them off when they are losing money. If only it were so easy!
Basically, for most trading strategies, THE BENEFIT OF EQUITY CURVE TRADING IS A MYTH. Good strategies - ones that always perform well - don't need an on/off equity curve switch.
Poor strategies definitely need an "off switch" - one that probably stays in the off position forever.
The halfway decent strategies - most strategies out there - are the ones that could really benefit from equity curve trading. Such curves are studied below.
With many of the basics of equity curve trading covered, this article will look at two different methods of equity curve trading, applied to three different real life trading strategies. Reviewing the results may allow some generalizations and conclusions about equity curve trading to be made.
Strategies Under Scrutiny
Three unique, real world trading strategies will be examined in Tradestation software with and without equity curve trading approaches. These systems are:
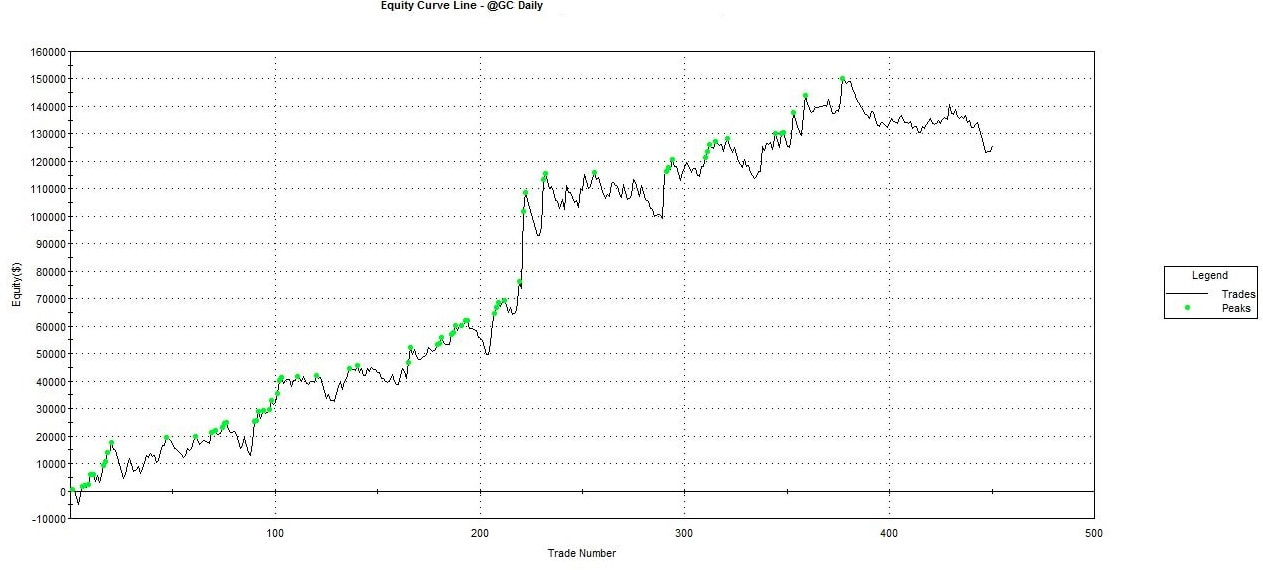
GC – Gold, swing strategy based on daily bars, “pit” hours
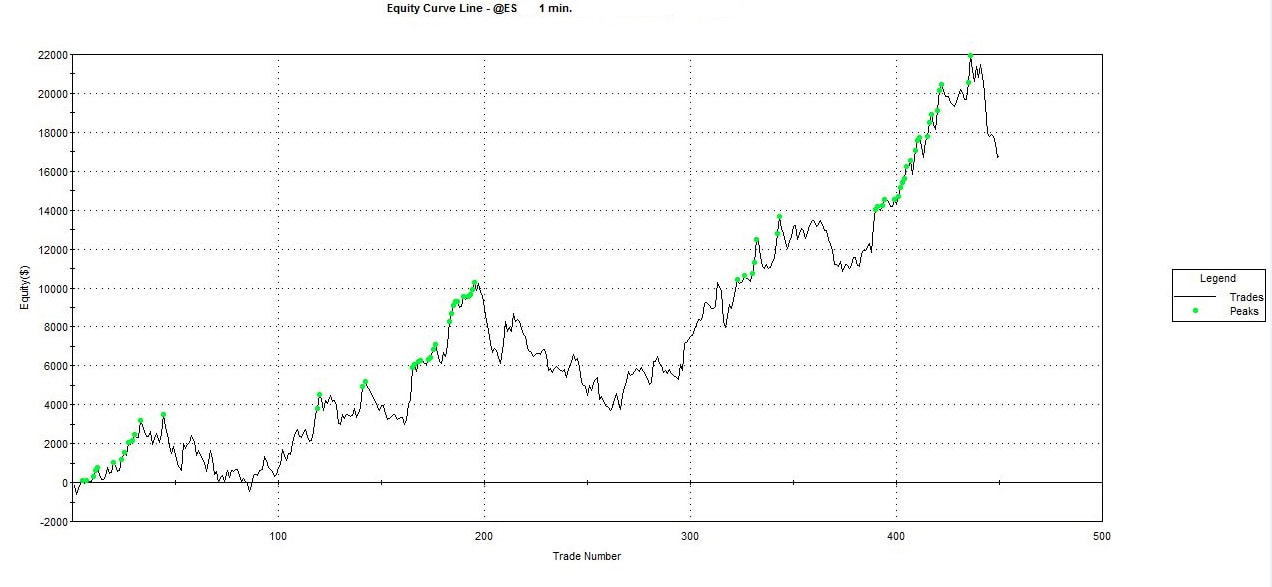
ES – Mini S&P, intraday strategy based on 1 minute bars
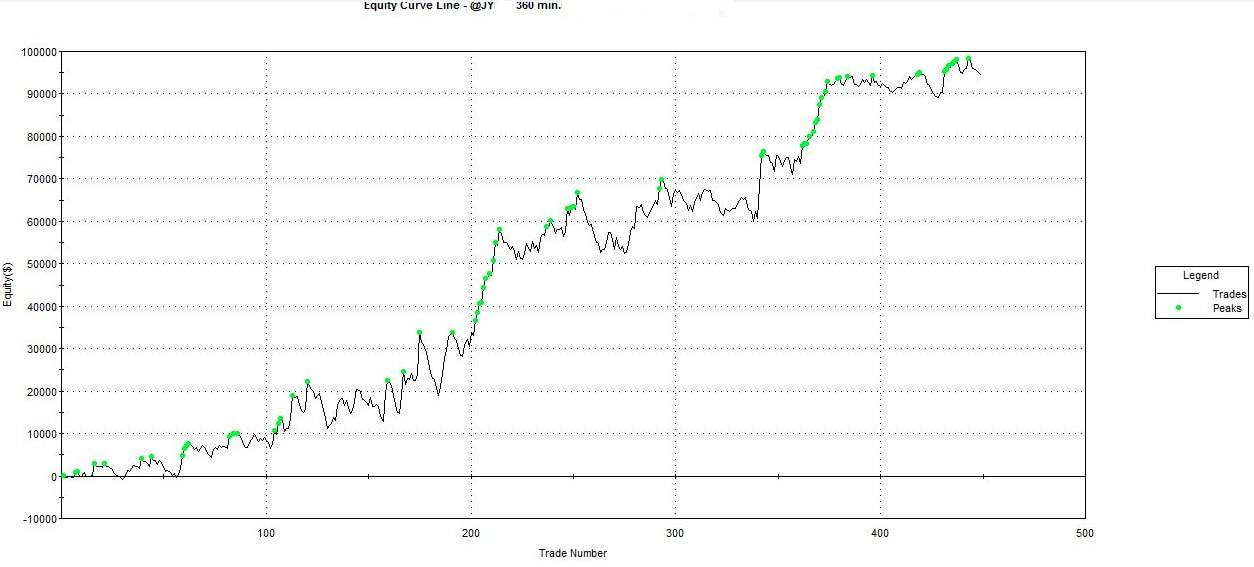
JY – Japanese Yen, swing strategy based on 360 minute bars
For each strategy, the most recent 450 trades will be studied, all of which trade 1 contract per trade only. This represents 3 to 9 years of trades, depending on the strategy. All trades are either from live trading, or from out-of-sample walkforward backtesting. No in-sample results are shown. These strategies are all different, with different stop losses, profit targets, entries, etc.
The closed trade equity curves for each of the strategies are shown in Figures 1 to 3.
Basically, for most trading strategies, THE BENEFIT OF EQUITY CURVE TRADING IS A MYTH. Good strategies - ones that always perform well - don't need an on/off equity curve switch.
Poor strategies definitely need an "off switch" - one that probably stays in the off position forever.
The halfway decent strategies - most strategies out there - are the ones that could really benefit from equity curve trading. Such curves are studied below.
With many of the basics of equity curve trading covered, this article will look at two different methods of equity curve trading, applied to three different real life trading strategies. Reviewing the results may allow some generalizations and conclusions about equity curve trading to be made.
Strategies Under Scrutiny
Three unique, real world trading strategies will be examined in Tradestation software with and without equity curve trading approaches. These systems are:
GC – Gold, swing strategy based on daily bars, “pit” hours
ES – Mini S&P, intraday strategy based on 1 minute bars
JY – Japanese Yen, swing strategy based on 360 minute bars
For each strategy, the most recent 450 trades will be studied, all of which trade 1 contract per trade only. This represents 3 to 9 years of trades, depending on the strategy. All trades are either from live trading, or from out-of-sample walkforward backtesting. No in-sample results are shown. These strategies are all different, with different stop losses, profit targets, entries, etc.
The closed trade equity curves for each of the strategies are shown in Figures 1 to 3.
Evaluation Process
Two different methods of equity curve trading will be examined in this study. The first method is to use a moving average of the equity curve as the criteria for turning on and off the strategy. When the “always on” equity is above the moving average line, the strategy will trade as normal. But, when the “always on” equity curve drops below the moving average, the strategy will be temporarily turned off, until the equity curve again crosses above the moving average.
Different length moving averages will be examined. 10, 25 and 40 period moving averages will be used.
The second method of equity curve trading will be using a new equity curve low as the cutoff criteria. In the same manner as the moving average approach, the strategy will be turned off when a new X trade low in the equity curve is reached, and turned on when the equity curve is above this value.
To keep consistency between the two approaches, the 10, 25 and 40 period lows of the equity curve will be used.
It should be mentioned again that the two aforementioned approaches are very common in equity curve trading, but are by no means the only methods. Practically any indicator can be applied to an equity curve, in the same way these indicators can be applied to actual price data. This, of course, opens up a whole Pandora’s Box of possible approaches, with practically an infinite number of possibilities when indicator parameters are factored in. Such a situation inevitably leads to over optimization and curve fitting, as the trader attempts to “tune” an equity curve trading approach to his particular equity curve.
Results – GC Strategy
Results for the GC (Gold) strategy are shown in the table below. As mentioned in Part I, although net profit and maximum drawdown are important numbers, the ratio of the two (net profit / maximum drawdown) is of primary concern. A higher ratio is better, since it tells us that we are receiving more profit for each dollar of drawdown.

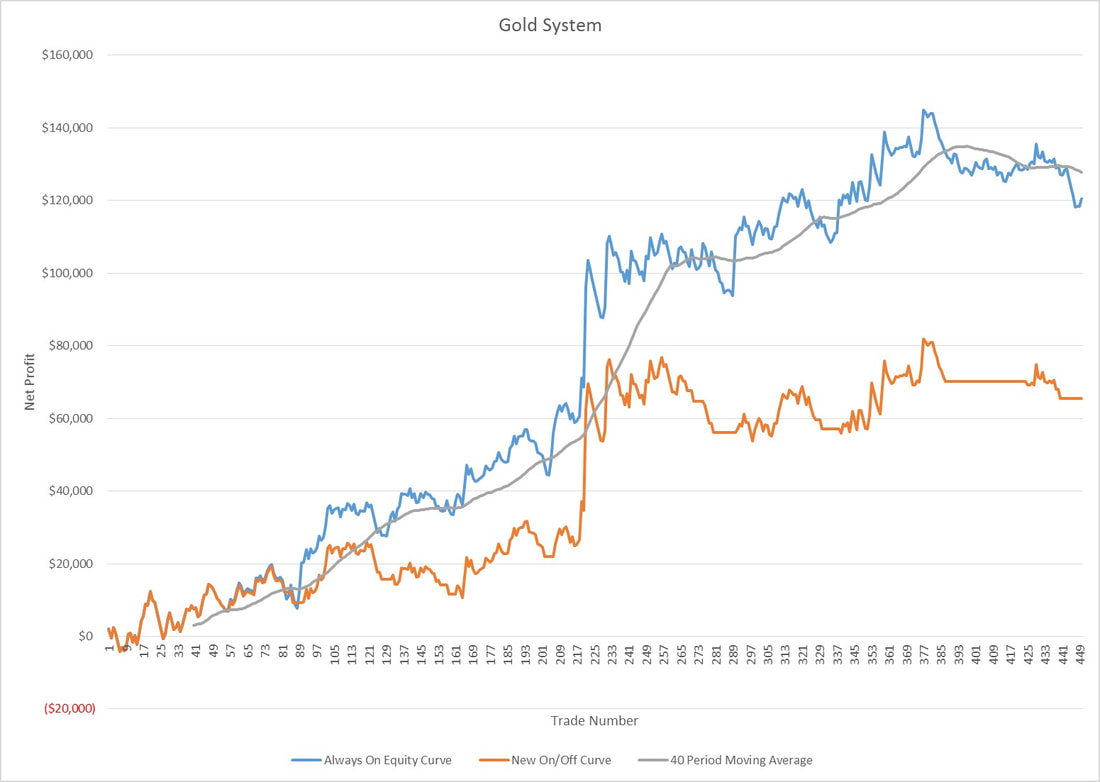
As can be seen in the table above, equity curve trading for the Gold strategy is almost always worse when compared to the “always on” approach. An example of the different equity curves for the moving average technique is shown in Figure 4. In this case, it is very clear that the equity curve trading approach is harmful. While steep drawdowns are many times stopped by the equity curve trading, significant upside trades are also missed, with the net effect being poorer overall performance.
Results – ES Strategy
Results for the ES (mini S&P) strategy are shown in the table below.
Results for the ES (mini S&P) strategy are shown in the table below.
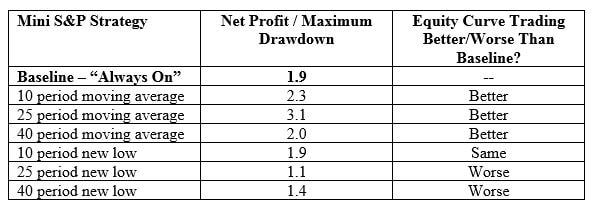
As can be seen in the table above, equity curve trading for the ES strategy is better for the moving average approach, but worse for the new low approach. Also, the degree of improvement is highly dependent on the choice for the lookback period. There is no “one size fits all” approach for this particular strategy. In case you are wondering why I used return/drawdown for my criteria, I explain it in this useful article of important trading metrics.
Results – JY Strategy
Results for the JY (Japanese Yen) strategy are shown in the table below.
Results – JY Strategy
Results for the JY (Japanese Yen) strategy are shown in the table below.
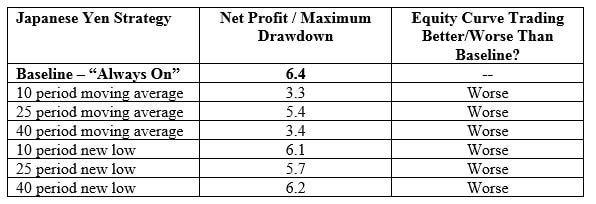
As shown above, equity curve trading for the Yen strategy is always worse than just letting the strategy trade continuously, sometimes significantly worse. Also, the new low technique is better than the moving average technique. Both methods underperform the “always on” case, sometimes by quite a large margin.
Discussion of Overall Results
For these three real life strategies, the equity curve trading approaches do not improve performance, except in a limited number of cases. This highlights three important issues with equity curve trading.
First, the results depend on the strategy being traded. Not every strategy will act the same for each method of equity curve trading. This can be seen in the contrast between the ES strategy, where equity curve trading can improve performance, and the Japanese Yen strategy, where equity curve trading never improves performance.
Second, the choice of equity curve technique is also critical. It may be that one particular approach improves the performance, but a different approach harms performance. This is evident in the ES strategy, where only the moving average approach improves the strategy.
Finally, even within one approach, the choice of parameter (look back period in this case) for the equity curve trading has a large, but not consistent, impact. This is clearly evident in the Gold strategy, where a wide range of profit to drawdown ratios are possible, simply by changing the lookback period.
Conclusion
Equity Curve Trading definitely has its proponents in the industry, some of them quite vocal. But, the overall efficacy of the approach is certainly not crystal clear. In fact, what is clear is that it is relatively easy to take a good strategy, and significantly degrade its performance by employing equity curve trading. While the overall objective of equity curve trading is unquestionable – cease trading poor performing strategies - it is probable that there are better ways of accomplishing that goal. From this study, the conclusion is equity curve trading with simple indicators has more downside than upside.
Two other important considerations to consider. Equity Curve Trading is not very easy to implement in an automated trading strategy/platform. You need to consider the pros and cons of automated trading, and the pros and cons of equity curve trading, to see if this really fits what you want to accomplish in the markets.
Addendum
I wanted to give some additional information regarding this article. When this article was initially released, I received a not-so-nice phone call from Murray Ruggerio, long time trading vendor and associate editor at Futures Magazine. Murray considers himself the "father" of equity curve trading, as he has been analyzing this approach for over 20 years.
I'm guessing my not-so-favorable-view of equity curve trading rankled him a bit.
Actually, since he considers himself the "father," I'm guessing he was pretty pissed about my knock on his "child."
But I let the data tell the story...
Anyhow, he provided a couple of last gasp ideas, which I share below, that might help those wanting to use equity curve trading.
The first point is that trade dependency can have a big impact of equity curve trading effectiveness. I did not mention this in the article, since most people apply equity curve trading to each of their systems, without checking for trade dependency. Trade dependency (also known as serial correlation) is when the result of trade X is dependent (correlated) with the result of the previous trade X-1. This might occur, for instance, if the trader waits a few bars to re-enter after losing trades, but not after winning trades. When trade results exhibit dependency, the equity curve approach typically performs a lot better. There are statistical tests a trader can run to check for dependency, and this might be a good check before applying the equity curve method.
My research on this is if you have trade dependency, then equity curve trading could work. Problem is, 9 out of 10 algo strategies do NOT have this dependency.
The second point Murray brought up is that it may be useful to look at equity curve trading independently for both long and short trades. This is because long trades and short trades by themselves may exhibit trade dependency, where the combined trades do not. Running equity curve trading separately on long and short trades may perform much better.
I have not done any research on this, but I'd be surprised if it is true. Please e-mail me if you test this and find it worthwhile.
Even after accounting for trade dependency, and treating long and short trades separately, the trader still has to be careful when using equity curve trading. In addition to over-optimizing (running various moving average lengths until one "fits"), many people make mistakes when calculating equity curve trading in a spreadsheet or by hand. So, equity curve trading might be right for some traders in certain situations, but care must be taken to ensure the results are actually valid.
HTML Comment Box is loading comments...

About Author: Kevin Davey is an award winning private futures, forex and commodities trader. He has been trading for over 25 years.Three consecutive years, Kevin achieved over 100% annual returns in a real time, real money, year long trading contest, finishing in first or second place each of those years.
Kevin is the author of the highly acclaimed algorithmic trading book "Building Algorithmic Trading Systems: A Trader's Journey From Data Mining to Monte Carlo Simulation to Live Trading" (Wiley 2014). Kevin provides a wealth of trading information at his website: http://www.kjtradingsystems.com
Copyright, Kevin Davey and KJ Trading Systems. All Rights Reserved. Reprint of above article is permitted, as long as the About The Author information is included.