
Stop Loss Alternative For Algo Trading Strategies?
Updated March 2024
If you’ve been following my work (https://kjtradingsystems.com/articles.html) for any period of time, you’ll know I’ve done quite a bit of research into which exit approaches are good, and which are not. I have a few articles on the subject:
What 567,000 Backtests Taught Me About Algo Trading Exits
https://kjtradingsystems.com/algo-trading-exits.html
Trailing Stops And Dollar Stops - Can These 378,000 Backtests Beat Stop & Reverse Exits?
https://kjtradingsystems.com/can-these-exits-beat-stop-and-reverse.html
My general conclusion was that stop losses generally hinder trading strategy performance.
Because of that, in recent videos I have released (https://www.youtube.com/@AlgoTradingWithKevinDavey) I test quite a few algo trading strategies that do not use stop losses.
And I get pointed comments of these videos because of this lack of stop losses. Some might even say nasty comments. Certainly many are dismissive of eliminating stop losses.
Boil down these comments, and it is clear that most traders are programmed to demand stop losses in their strategies. Stop losses are considered a given “must have” for many people. And I get that, I understand it, and agree with it – AS LONG AS YOU DECIDE ON INCLUDING STOP LOSSES AFTER KNOWING ALL THE FACTS:
OK, I’ll admit I am biased against stop losses – although I do use them in quite a few of my strategies. And I’ll admit that sometimes I’ve gotten 3rd degree burns from not having stop losses. I remember being in a Coffee trade with no stop that cost me over $15,000 per contract! That pretty much sucked, to be crudely blunt.
With all that in mind, I’ve always wondered if maybe we all think about stops in the wrong way. Traditional thinking says stops should apply to individual trades. But what about an alternative – a “stop loss” based on monthly losses? For example, the strategy itself may or may not have a stop loss for each trade - but regardless of that – if the strategy loses $1000 or $2000 or $5000 in a month, maybe the strategy should close all positions and take a break until the next month before resuming trading. Maybe that is worth doing?
Of course, when I have crazy thoughts like this, I usually want to prove or disprove it. Just ask my Strategy Factory students how I ran 50 million backtests over 6+ months just to confirm and improve my strategy development approach. For me, it is all data based decision making.
So let’s run some tests…
Over the next few weeks, I’m going to share with you what I have found:
Can Algo Traders Use Monthly “Stops” To Improve Strategy Performance?
Part 1 – General Setup Description, Dollar Based Results
Part 2 – Average True Range Based Results
Part 3 – Dollar Based Results, With An ATR Twist
Part 4 – Variable Dollar Based Profit Exit
Part 5 – One Final Improvement On The Concept?
Conclusion
Before I get into everything, please keep in mind that I am not going to burden you with theory, heavy mathematical equations and the like. Nor will I try to justify my conclusions with statistical analysis, confidence intervals, etc. I’m a trader, not a theoretical mathematician or statistician. I’ll just present the results and give you my interpretation of them, based on my trading experience. For example, if two cases yield a 5% difference in results, I’m not going to award a victor or loser. That small difference might be important to some data analysts, but to a trader like me such results are probably meaningless. Unless the differences are dramatic, my philosophy is there is no point in making a strategy more complicated just for the sake of a small improvement. My students will tell you my mantra: smart simplicity rules the day.
With that, let’s lay out the study.
If you’ve been following my work (https://kjtradingsystems.com/articles.html) for any period of time, you’ll know I’ve done quite a bit of research into which exit approaches are good, and which are not. I have a few articles on the subject:
What 567,000 Backtests Taught Me About Algo Trading Exits
https://kjtradingsystems.com/algo-trading-exits.html
Trailing Stops And Dollar Stops - Can These 378,000 Backtests Beat Stop & Reverse Exits?
https://kjtradingsystems.com/can-these-exits-beat-stop-and-reverse.html
My general conclusion was that stop losses generally hinder trading strategy performance.
Because of that, in recent videos I have released (https://www.youtube.com/@AlgoTradingWithKevinDavey) I test quite a few algo trading strategies that do not use stop losses.
And I get pointed comments of these videos because of this lack of stop losses. Some might even say nasty comments. Certainly many are dismissive of eliminating stop losses.
Boil down these comments, and it is clear that most traders are programmed to demand stop losses in their strategies. Stop losses are considered a given “must have” for many people. And I get that, I understand it, and agree with it – AS LONG AS YOU DECIDE ON INCLUDING STOP LOSSES AFTER KNOWING ALL THE FACTS:
- Stop losses will generally degrade your trading performance. It is the price you pay for the security they (supposedly) bring. In all the historical testing I have done, I don’t recall seeing many cases where adding a stop loss made a strategy better. They usually reduce profit, and do not improve risk adjusted metrics like profit/drawdown.
- Stop losses are great psychologically, because you can sleep tight (thinking) you have stops in the market.
- Stop losses can be useless in an earth shaking event. The price might gap right past your stop, and you end up never even getting filled.
- Stop losses are not used by many professional traders. At least that is what they say. Maybe they are lying, who knows.
- Stop losses are typically placed at “obvious” spots, and the market seems to seek them out before reversing.
- Stop losses are generally set way too tight. Many traders like $50 stops in the mini S&P (ES), thinking that will save them from declines. Turns out, because of market volatility, getting hit on 10 $50 stops is a lot easier than hitting 1 $500 stop.
- Stop losses do force you to exit in a losing trade, and help to enforce discipline. Hard to blow out an account in only a few trades if you have a reasonable stop loss.
OK, I’ll admit I am biased against stop losses – although I do use them in quite a few of my strategies. And I’ll admit that sometimes I’ve gotten 3rd degree burns from not having stop losses. I remember being in a Coffee trade with no stop that cost me over $15,000 per contract! That pretty much sucked, to be crudely blunt.
With all that in mind, I’ve always wondered if maybe we all think about stops in the wrong way. Traditional thinking says stops should apply to individual trades. But what about an alternative – a “stop loss” based on monthly losses? For example, the strategy itself may or may not have a stop loss for each trade - but regardless of that – if the strategy loses $1000 or $2000 or $5000 in a month, maybe the strategy should close all positions and take a break until the next month before resuming trading. Maybe that is worth doing?
Of course, when I have crazy thoughts like this, I usually want to prove or disprove it. Just ask my Strategy Factory students how I ran 50 million backtests over 6+ months just to confirm and improve my strategy development approach. For me, it is all data based decision making.
So let’s run some tests…
Over the next few weeks, I’m going to share with you what I have found:
Can Algo Traders Use Monthly “Stops” To Improve Strategy Performance?
Part 1 – General Setup Description, Dollar Based Results
Part 2 – Average True Range Based Results
Part 3 – Dollar Based Results, With An ATR Twist
Part 4 – Variable Dollar Based Profit Exit
Part 5 – One Final Improvement On The Concept?
Conclusion
Before I get into everything, please keep in mind that I am not going to burden you with theory, heavy mathematical equations and the like. Nor will I try to justify my conclusions with statistical analysis, confidence intervals, etc. I’m a trader, not a theoretical mathematician or statistician. I’ll just present the results and give you my interpretation of them, based on my trading experience. For example, if two cases yield a 5% difference in results, I’m not going to award a victor or loser. That small difference might be important to some data analysts, but to a trader like me such results are probably meaningless. Unless the differences are dramatic, my philosophy is there is no point in making a strategy more complicated just for the sake of a small improvement. My students will tell you my mantra: smart simplicity rules the day.
With that, let’s lay out the study.
Markets
I am going to test 42 futures symbols:
@AD,@BO,@BP,@C,@CC,@CD,@CL,@CT,@DX,@EC,@ES.D,@ES,@FC,@FV,@GC,@HG,@HO,@JY,@KC,@KW,@LC,@LH,@MP1,@NG,@NK,@NQ,@O,@OJ,@PL,@RB,@RR,@RTY,@S,@SB,@SF,@SI,@SM,@TU,@TY,@US,@W,@YM
This represents a very diversified group of instruments, in 7 major sectors:
Bar Sizes
I am going to test over 5 different bar sizes:
1440,720,360,180,90 (all minutes)
The 1440 minute bar is basically a daily bar (but does not use the Exchange settlement price for the close), and the others usually have multiple bars per day. But the smaller bar sizes do not imply those are only for intraday trading strategies. You could easily have a 90 minute bar signal that leads to a week long trade position.
Monthly Loss Code
The monthly loss code is pretty straightforward. At the close of every bar, the current strategy net equity is calculated and stored as “CurrentEquity.” Then, at the start of each month, the equity as of the close of the previous month is recorded as “NewMonthEquity.”
Depending on the monthly exit switch, the gain or loss for the current month is calculated, and if it exceeds a certain amount in that month ($2500 or $5000 per contract), trading is turned off until the next month.
Note there are 5 monthly exits:
Here is the code I use, in Tradestation Easy Language format.
var: CurrentEquity(0),CurrentMonth(0),NewMonthEquity(0);
CurrentEquity = NetProfit + OpenPositionProfit;
CurrentMonth = Month(date);
If CurrentMonth<>CurrentMonth[1] then Begin
NewMonthEquity = CurrentEquity[1];
end;
Var:CanTradeMonthly(False);
CanTradeMonthly=True;
If IMonthly=1 then Begin
CanTradeMonthly=True;
End;
If IMonthly=2 and CurrentEquity - NewMonthEquity < -2500 then Begin
CanTradeMonthly=False;
End;
If IMonthly=3 and CurrentEquity - NewMonthEquity < -5000 then Begin
CanTradeMonthly=False;
End;
If IMonthly=4 and CurrentEquity - NewMonthEquity > 2500 then Begin
CanTradeMonthly=False;
End;
If IMonthly=5 and CurrentEquity - NewMonthEquity > 5000 then Begin
CanTradeMonthly=False;
End;
//close any open trades if monthly switch is hit
If CanTradeMonthly=false then Begin
sell ("Monthly Cease") next bar at market;
buytocover ("Monthly Cease2") next bar at market;
End;
//note all entries need to be wrapped in this IF block to trade only when allowed
If CanTradeMonthly then Begin
…entries here
End;
Base Entries
I am going to use 4 fairly standard and well known entries for this test.
These are all basically trend following type entries. Here is the code in Tradestation Easy Language format for each:
// inputvar1 = 1 - momentum strategy
If inputvar1 = 1 then begin
if close>close[InputVar2] then buy next bar at market;
if close<close[InputVar2] then sellshort next bar at market;
End;
// inputvar1 = 2 - breakout strategy
If inputvar1 = 2 then begin
if high=highest(high,InputVar2) then buy next bar at market;
if low=lowest(low,InputVar2) then sellshort next bar at market;
End;
// inputvar1 = 3 - mov avg strategy
If inputvar1 = 3 then begin
if close>average(close,InputVar2) then buy next bar at market;
if close<average(close,InputVar2) then sellshort next bar at market;
End;
// inputvar1 = 4 - 2mov avg strategy
If inputvar1 = 4 then begin
if close>average(close,InputVar2) and average(close,InputVar2)>average(close,2*InputVar2) then buy next bar at market;
if close<average(close,InputVar2) and average(close,InputVar2)<average(close,2*InputVar2) then sellshort next bar at market;
End;
With this code, “inputVar1” defines the entry type, and “InputVar2” is a lookback length (which will be optimized as part of walkforward testing).
Reverse Entries
Since all 4 of the base entries are basic trend followers, I decided to include the reverse of all those entries, which gives me 4 more entries to test. For example:
// inputvar1 = 1 - momentum strategy
If inputvar1 = 1 then begin
if close>close[InputVar2] then buy next bar at market;
if close<close[InputVar2] then sellshort next bar at market;
End;
When reversed is just
// inputvar1 = 5 – reverse momentum strategy
If inputvar1 = 5 then begin
if close>close[InputVar2] then sellshort next bar at market;
if close<close[InputVar2] then buy next bar at market;
End;
Doing this gives me 8 unique entries.
Exits
I will combine these 8 entries with 7 different exits:
The Tradestation Easy Language code for all these is shown below. Note that these are not “traditional” stops and targets like SetStopLoss(1000) or Set ProfitTarget(1500). The exits I use are market orders based on the open position profit at the close of each bar. I have found these “closing price exits” to be more reliable in automated trading (maybe that is just for me though!). Also, there are a few bugs in Tradestation which can prevent accurate results with SetStopLoss and SetProfitTarget.
If IExit=0 then Begin
//no exit;
end;
If Iexit = 1 then begin
//stop loss
if openpositionprofit<-InputVar3 then Begin
sell next bar at market;
buytocover next bar at market;
end;
end;
If Iexit = 2 then begin
//profit target
if openpositionprofit>InputVar3 then Begin
sell next bar at market;
buytocover next bar at market;
end;
end;
If Iexit = 3 then begin
//stop loss and profit target
if openpositionprofit<-InputVar3 or openpositionprofit>InputVar3 then Begin
sell next bar at market;
buytocover next bar at market;
end;
end;
If Iexit = 4 then begin
//catastrophic (huge) stop loss
if openpositionprofit<-5000 then Begin
sell next bar at market;
buytocover next bar at market;
end;
end;
If Iexit = 5 then begin
//trailing stop
if maxpositionprofit - openpositionprofit>InputVar3 then Begin
sell next bar at market;
buytocover next bar at market;
end;
end;
If Iexit = 6 then begin
//trailing stop which tightens
if maxpositionprofit>InputVar3 and maxpositionprofit - openpositionprofit>(InputVar3/2) then Begin
sell next bar at market;
buytocover next bar at market;
end;
if maxpositionprofit<=InputVar3 and maxpositionprofit - openpositionprofit>InputVar3 then Begin
sell next bar at market;
buytocover next bar at market;
end;
end;
“Iexit” is the exit type and “InputVar3” is dollar amount for the stops and targets (sometimes multiplied by a factor).
Strategies - All Together
When I combine these entries and exits, I am using one entry and one exit, and considering that one unique strategy. For example, entry #1 with exit #0 is one strategy. Entry #1 with exit #1 is a different strategy. Note that in any particular strategy/test, I only use one entry and one exit throughout the whole history. I do not, for example, switch from momentum entry to breakout entry halfway through a particular run.
Consequently, I have 8 entries x 7 exits = 56 unique strategies to test.
Testing
Just to give you an idea of how much testing is involved here:
Add it all up, and I ran 1,470,000 unique iterations for Part 1 of this test, generating 352,800 unique final equity curves. In other words, a TON of analysis!
This would take you AGES to run with standard Tradestation charts and optimization. You’d be changing the symbol, bar size and/or symbol on the chart, running optimizations, compiling results then starting over with next market/bar/strategy. Overwhelming for sure. Time consuming for double sure!
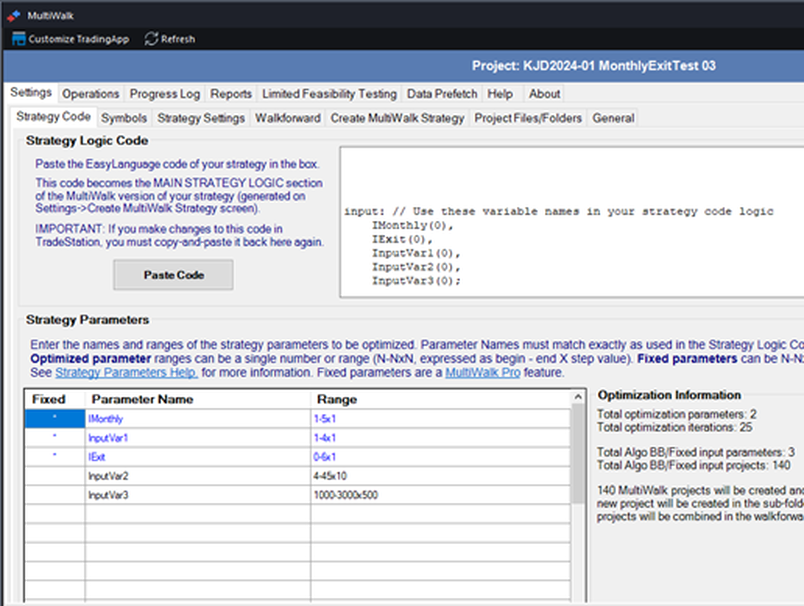
Luckily for me, I have a software tool called MultiWalk (https://multiwalk.net). Written by a programming savant Strategy Factory student of mine, this tool allows me to quickly run tests by programmatically accessing the Tradestation Optimization API. That saves a ton of time and aggravation in testing. This amazing tool is provided free to my Platinum Strategy Factory students, and is only available to my students (Sorry!).
I am going to test 42 futures symbols:
@AD,@BO,@BP,@C,@CC,@CD,@CL,@CT,@DX,@EC,@ES.D,@ES,@FC,@FV,@GC,@HG,@HO,@JY,@KC,@KW,@LC,@LH,@MP1,@NG,@NK,@NQ,@O,@OJ,@PL,@RB,@RR,@RTY,@S,@SB,@SF,@SI,@SM,@TU,@TY,@US,@W,@YM
This represents a very diversified group of instruments, in 7 major sectors:
- Currencies
- Agriculturals
- Energies
- Metals
- Stock Indices
- Interest Rates
- Softs
Bar Sizes
I am going to test over 5 different bar sizes:
1440,720,360,180,90 (all minutes)
The 1440 minute bar is basically a daily bar (but does not use the Exchange settlement price for the close), and the others usually have multiple bars per day. But the smaller bar sizes do not imply those are only for intraday trading strategies. You could easily have a 90 minute bar signal that leads to a week long trade position.
Monthly Loss Code
The monthly loss code is pretty straightforward. At the close of every bar, the current strategy net equity is calculated and stored as “CurrentEquity.” Then, at the start of each month, the equity as of the close of the previous month is recorded as “NewMonthEquity.”
Depending on the monthly exit switch, the gain or loss for the current month is calculated, and if it exceeds a certain amount in that month ($2500 or $5000 per contract), trading is turned off until the next month.
Note there are 5 monthly exits:
- No monthly loss switch (baseline case)
- Monthly loss of $2500
- Monthly loss of $5000
- Monthly gain of $2500 (will be discussed later)
- Monthly gain of $5000 (will be discussed later)
Here is the code I use, in Tradestation Easy Language format.
var: CurrentEquity(0),CurrentMonth(0),NewMonthEquity(0);
CurrentEquity = NetProfit + OpenPositionProfit;
CurrentMonth = Month(date);
If CurrentMonth<>CurrentMonth[1] then Begin
NewMonthEquity = CurrentEquity[1];
end;
Var:CanTradeMonthly(False);
CanTradeMonthly=True;
If IMonthly=1 then Begin
CanTradeMonthly=True;
End;
If IMonthly=2 and CurrentEquity - NewMonthEquity < -2500 then Begin
CanTradeMonthly=False;
End;
If IMonthly=3 and CurrentEquity - NewMonthEquity < -5000 then Begin
CanTradeMonthly=False;
End;
If IMonthly=4 and CurrentEquity - NewMonthEquity > 2500 then Begin
CanTradeMonthly=False;
End;
If IMonthly=5 and CurrentEquity - NewMonthEquity > 5000 then Begin
CanTradeMonthly=False;
End;
//close any open trades if monthly switch is hit
If CanTradeMonthly=false then Begin
sell ("Monthly Cease") next bar at market;
buytocover ("Monthly Cease2") next bar at market;
End;
//note all entries need to be wrapped in this IF block to trade only when allowed
If CanTradeMonthly then Begin
…entries here
End;
Base Entries
I am going to use 4 fairly standard and well known entries for this test.
- Simple Momentum
- Breakout
- Moving Average
- Dual Moving Average
These are all basically trend following type entries. Here is the code in Tradestation Easy Language format for each:
// inputvar1 = 1 - momentum strategy
If inputvar1 = 1 then begin
if close>close[InputVar2] then buy next bar at market;
if close<close[InputVar2] then sellshort next bar at market;
End;
// inputvar1 = 2 - breakout strategy
If inputvar1 = 2 then begin
if high=highest(high,InputVar2) then buy next bar at market;
if low=lowest(low,InputVar2) then sellshort next bar at market;
End;
// inputvar1 = 3 - mov avg strategy
If inputvar1 = 3 then begin
if close>average(close,InputVar2) then buy next bar at market;
if close<average(close,InputVar2) then sellshort next bar at market;
End;
// inputvar1 = 4 - 2mov avg strategy
If inputvar1 = 4 then begin
if close>average(close,InputVar2) and average(close,InputVar2)>average(close,2*InputVar2) then buy next bar at market;
if close<average(close,InputVar2) and average(close,InputVar2)<average(close,2*InputVar2) then sellshort next bar at market;
End;
With this code, “inputVar1” defines the entry type, and “InputVar2” is a lookback length (which will be optimized as part of walkforward testing).
Reverse Entries
Since all 4 of the base entries are basic trend followers, I decided to include the reverse of all those entries, which gives me 4 more entries to test. For example:
// inputvar1 = 1 - momentum strategy
If inputvar1 = 1 then begin
if close>close[InputVar2] then buy next bar at market;
if close<close[InputVar2] then sellshort next bar at market;
End;
When reversed is just
// inputvar1 = 5 – reverse momentum strategy
If inputvar1 = 5 then begin
if close>close[InputVar2] then sellshort next bar at market;
if close<close[InputVar2] then buy next bar at market;
End;
Doing this gives me 8 unique entries.
Exits
I will combine these 8 entries with 7 different exits:
- No exit (stop and reverse, a “buy” entry exits any short and then goes long. Vice versa for the short trades).
- Stop Loss
- Profit Target
- Stop Loss and Profit Target
- Catastrophic Stop Loss
- Trailing Stop
- Trailing Stop Which Tightens After Profit Threshold Achieved
The Tradestation Easy Language code for all these is shown below. Note that these are not “traditional” stops and targets like SetStopLoss(1000) or Set ProfitTarget(1500). The exits I use are market orders based on the open position profit at the close of each bar. I have found these “closing price exits” to be more reliable in automated trading (maybe that is just for me though!). Also, there are a few bugs in Tradestation which can prevent accurate results with SetStopLoss and SetProfitTarget.
If IExit=0 then Begin
//no exit;
end;
If Iexit = 1 then begin
//stop loss
if openpositionprofit<-InputVar3 then Begin
sell next bar at market;
buytocover next bar at market;
end;
end;
If Iexit = 2 then begin
//profit target
if openpositionprofit>InputVar3 then Begin
sell next bar at market;
buytocover next bar at market;
end;
end;
If Iexit = 3 then begin
//stop loss and profit target
if openpositionprofit<-InputVar3 or openpositionprofit>InputVar3 then Begin
sell next bar at market;
buytocover next bar at market;
end;
end;
If Iexit = 4 then begin
//catastrophic (huge) stop loss
if openpositionprofit<-5000 then Begin
sell next bar at market;
buytocover next bar at market;
end;
end;
If Iexit = 5 then begin
//trailing stop
if maxpositionprofit - openpositionprofit>InputVar3 then Begin
sell next bar at market;
buytocover next bar at market;
end;
end;
If Iexit = 6 then begin
//trailing stop which tightens
if maxpositionprofit>InputVar3 and maxpositionprofit - openpositionprofit>(InputVar3/2) then Begin
sell next bar at market;
buytocover next bar at market;
end;
if maxpositionprofit<=InputVar3 and maxpositionprofit - openpositionprofit>InputVar3 then Begin
sell next bar at market;
buytocover next bar at market;
end;
end;
“Iexit” is the exit type and “InputVar3” is dollar amount for the stops and targets (sometimes multiplied by a factor).
Strategies - All Together
When I combine these entries and exits, I am using one entry and one exit, and considering that one unique strategy. For example, entry #1 with exit #0 is one strategy. Entry #1 with exit #1 is a different strategy. Note that in any particular strategy/test, I only use one entry and one exit throughout the whole history. I do not, for example, switch from momentum entry to breakout entry halfway through a particular run.
Consequently, I have 8 entries x 7 exits = 56 unique strategies to test.
Testing
Just to give you an idea of how much testing is involved here:
- 42 markets
- 5 bar sizes
- 56 strategies (8 entries x 7 exits)
- 5 unique monthly stop/target exits
- 5 lookback lengths
- 5 stop/target dollar amounts
- 6 IN/OUT periods for walkforward testing
Add it all up, and I ran 1,470,000 unique iterations for Part 1 of this test, generating 352,800 unique final equity curves. In other words, a TON of analysis!
This would take you AGES to run with standard Tradestation charts and optimization. You’d be changing the symbol, bar size and/or symbol on the chart, running optimizations, compiling results then starting over with next market/bar/strategy. Overwhelming for sure. Time consuming for double sure!
Luckily for me, I have a software tool called MultiWalk (https://multiwalk.net). Written by a programming savant Strategy Factory student of mine, this tool allows me to quickly run tests by programmatically accessing the Tradestation Optimization API. That saves a ton of time and aggravation in testing. This amazing tool is provided free to my Platinum Strategy Factory students, and is only available to my students (Sorry!).
Results
Once I’ve completed all the runs with MultiWalk (which took about a week), I’ve got a ton of data to reduce. So how do I analyze all this, and determine what is good and not good?
I’ll spare you the details, but after a bunch of pre-analysis, I settled on 1 metric to look at:
Net Profit / Average Drawdown
And I am going to take the average value of this metric across all runs/iterations/cases. I like this performance metric because it encompasses reward and risk in one value.
Of course, if you used a different performance metric (say Net Profit, or Net Profit / Max Drawdown) or a different summary statistic (maybe using median values instead of average, or even using standard deviations) you could reach different conclusions that what I reach in the results ahead. But what I found is that when the finding is significant (not in exact statistical sense, but in magnitude) different performance metrics and summary approaches will likely all lead to the same end conclusion.
One note is that I am using Net Profit / AVERAGE Drawdown. Average Drawdown is not as popular as Maximum Drawdown, and in fact many trading platforms (Tradestation being one) do not even include it in their Performance Report. It is a value I find very useful, so I am going to take a short detour here and explain it a bit.
Quick explanation: Let’s say you have an equity curve that looks like this:
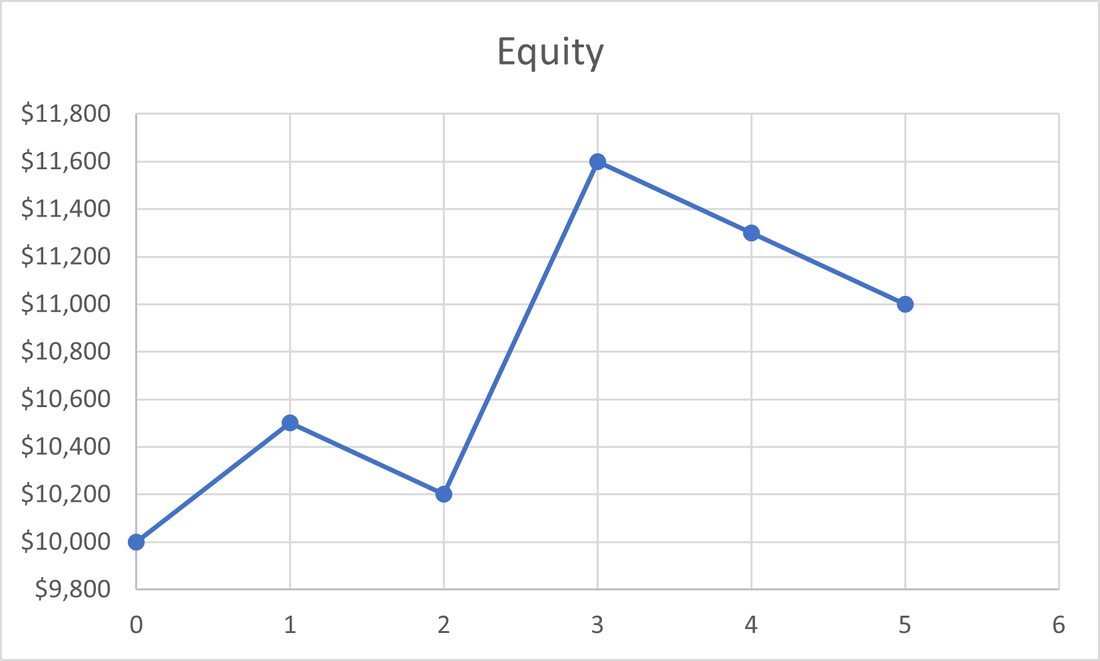
How do you determine the Average Drawdown over this period? It is pretty simple:
- Calculate the drawdown at end of each period or trade
- At end calculate the average of these individual drawdown values
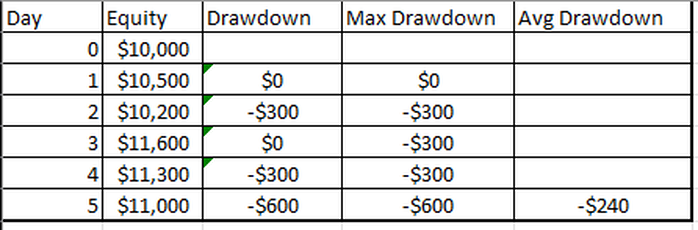
Why do I like Average Drawdown, as opposed to Maximum Drawdown? Maximum Drawdown looks at the whole equity curve, and gives the worst drawdown along that curve – one point in time. It tells you nothing about other drawdowns that may occur – ones that are below the maximum drawdown, but are still important. Average Drawdown includes all the drawdowns. Think of it like the pain you’d experience trading this equity curve. If the average was $0, you’d experience no pain!
Sorry for the diversion, now let’s look at actual results…
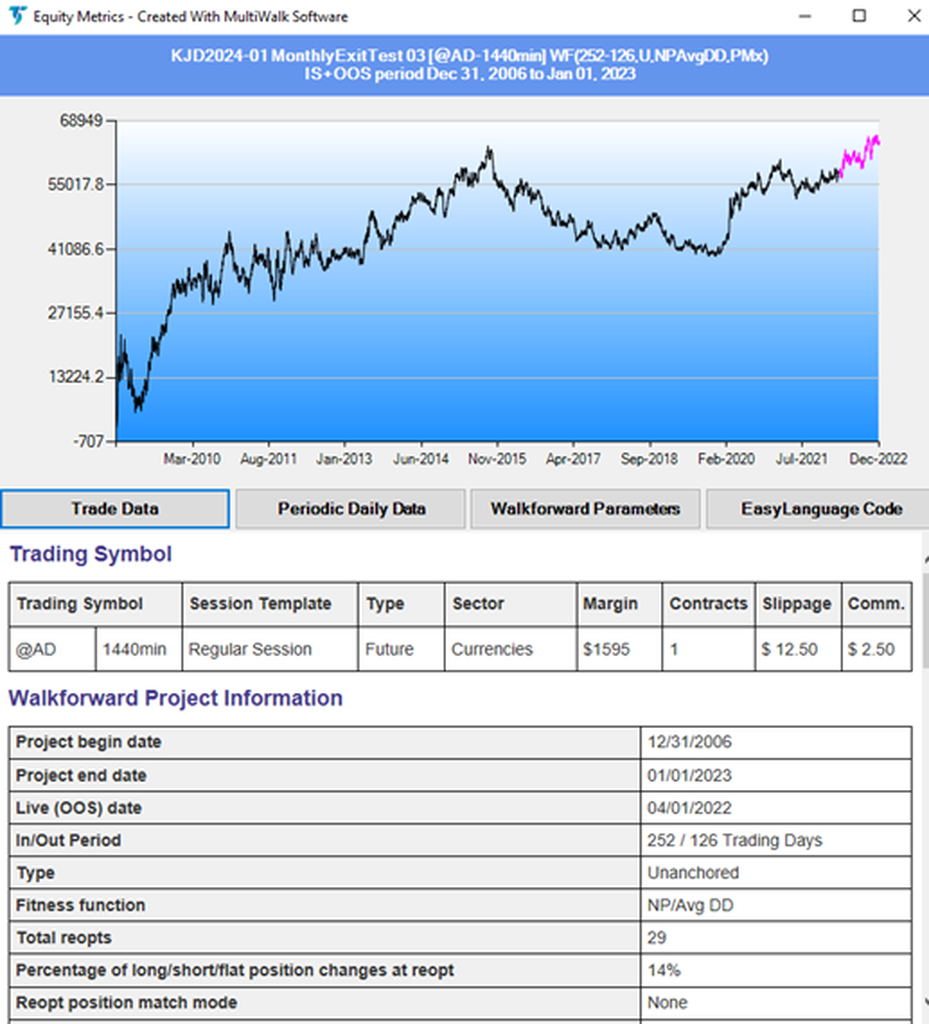
Here is what a strategy looks like with and without a monthly loss switch of $2500.
Sorry for the diversion, now let’s look at actual results…
Here is what a strategy looks like with and without a monthly loss switch of $2500.
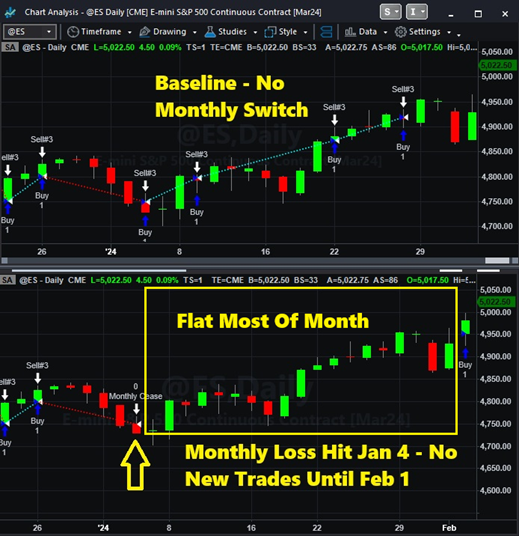
To make it easier to understand, I am going to compare the results to the baseline case, which is no monthly loss on/off switch. I am hoping to find situations where the results are better than the baseline results.
Here is our first result with the 4 standard strategies:
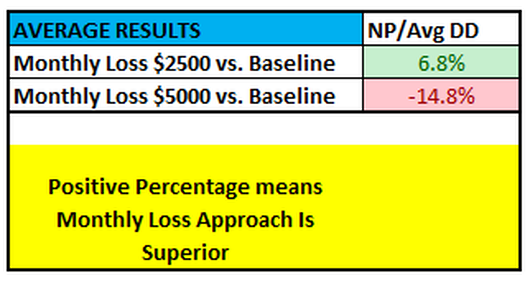
This tells us that having the monthly loss switch helps for a $2500 loss (+6.8% improvement compared to baseline) but does not help with a $5000 loss (-14.8% worse). What this is saying is that the switch appears to help by cutting off the strategy at small monthly losses, but it hurts performance with large losses (maybe the strategy would have recovered somewhat had it not been turned off).
A 6.8% improvement is not bad, but to me it is in a gray area – is the benefit worth the extra complexity? Maybe, but maybe not.
As a check on this result, lets take a look at results for the 4 reverse strategies:
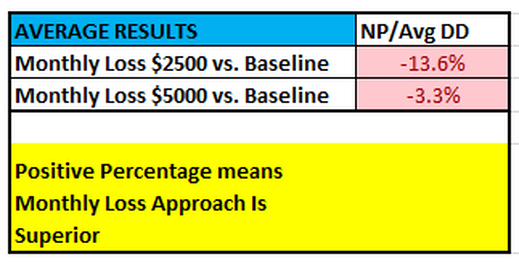
This confirms that a loss switch of $5000 does not help, but it also shows that a $2500 loss switch does not help either! It refutes that earlier result with the 4 standard strategies.
Certainly, it is possible that $2500 monthly loss switch could help, but I would not count on it. One set of results says it helps, but the other does not.
At this point, you might conclude that all this effort so far has been a waste of time. After all, I found this neat switch idea does not really help. UGH!
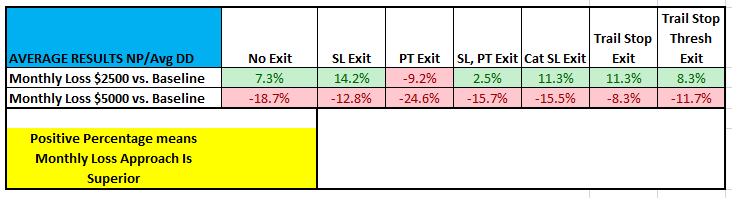
But there is one last thing to try. Maybe this switch works only with certain exits. Remember, we have 7 unique exits that we tested:
- No exit, just stop and reverse
- Stop Loss exit
- Profit Target exit
- Stop Loss and Profit Target exit
- Catastrophic Stop Loss Only exit
- Trailing Stop exit
- Trailing Stop Which Tightens After Profit Threshold Achieved exit
Maybe one or more of these exits works well with the monthly loss switch. Let’s take a look..
Base Strategies:
Reverse Strategies:
With the Base Strategies, the $2500 Monthly Loss does look good in some cases, but that is refuted by the Reverse Strategies. The $5000 Monthly Loss is almost always worse.
With that, here are our first 2 conclusions:
CONCLUSION 1: A $5000 monthly loss switch is detrimental to performance – DO NOT USE
CONCLUSION 2: A $2500 monthly loss switch inconclusive on improving performance – PROBABLY DO NOT USE
Thinking about it some more, I started to realize that these monthly stops might be acting just like strategy stop losses. In other words, they reduce performance! If that is true, then maybe instead of a monthly loss limit, a monthly profit target would be better. Let’s take a look:
//monthly LOSS switch
If IMonthly=2 and CurrentEquity - NewMonthEquity < -2500 then Begin
CanTradeMonthly=False;
End;
//monthly PROFIT switch
If IMonthly=4 and CurrentEquity - NewMonthEquity > 2500 then Begin
CanTradeMonthly=False;
End;
Here is what a strategy looks like with a monthly profit switch of $2500.
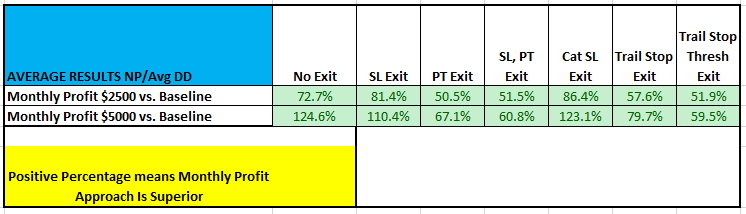
Here are the results for a $2500 and $5000 monthly profit switch…
Base Strategies:
Reverse Strategies:
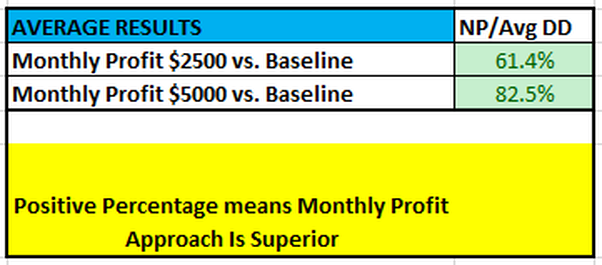
Nice! For both the 4 strategies and the 4 reverse strategies, performance improves with the monthly profit switch. Both the $2500 and $5000 amounts are significantly better than not having the switch.
How do the results look with the various exits? Do any of the exits stand out (good or bad)?
Base Strategies:
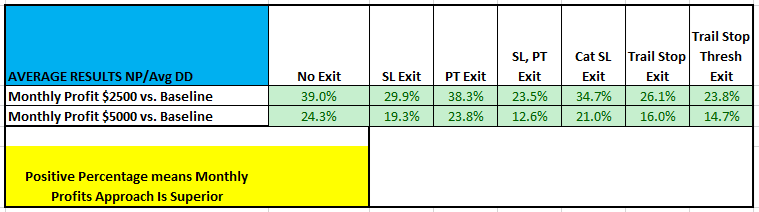
Reverse Strategies:
Interestingly enough, it seems that all exits work well with the monthly switch. So, you could still have a stop loss on the strategy itself, with a monthly profit target and still have quite an improvement over the baseline case.
These results lead us to Conclusion #3:
CONCLUSION 3: A $2500 or 5000 monthly profit switch improves performance – DEFINITELY CONSIDER USING
Some of you may be wondering why monthly stops are bad, but monthly profit targets are good. My theory is that if you start with a positive expectancy (profitable) strategy, cutting off trading during a month could be shutting down the strategy during a normal expected drawdown, or maybe a period of good luck. Since the strategy should make money long term, by turning it off you might never experience that profitable recovery.
On the monthly profit side, by stopping mid month after a profit, you “lock in” the profit before the next inevitable drawdown. So maybe you avoid or minimize some drawdowns by turning the strategy off after a profitable run. This also locks in profit after a streak of “good luck.”
That’s my explanation for this. Let me know what you think – I fully understand I could be inventing a narrative to fit the findings.
But what about “extreme” strategies? Ones that always win or always lose?
Let’s take a look at an “always losing” strategy, one that loses every day. Of course you’d never trade it, but if you did, you’d want the monthly loss switch in place, to minimize your losses.
And if you had an “always winning” strategy, one that never lost, having the monthly profit switch would be detrimental. It would artificially cap your gains.
I think it is safe to say that none of us have any “always losing” strategies (if you do, throw them out!), nor do we have “always winning” strategies (if you do, please let me know!). So for strategies in the middle, it looks like having a monthly profit switch can be a way to improve your performance.
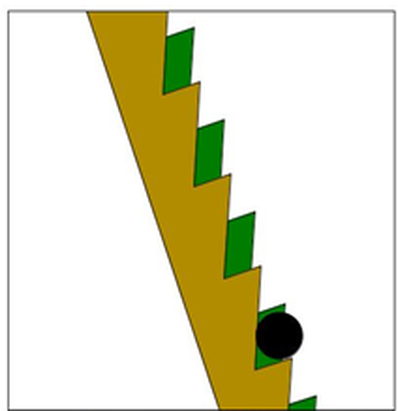
I don’t know if what we are seeing is related, but I’ve always been fascinated with Parrondo’s Paradox, where 2 losing strategies combine to create a winning strategy (links below for details, as the concept is more nuanced with the losing strategies than it first seems).
In the video below, imagine your strategy is the yellow staircase (which goes down continuously, losing money over time), the green staircase is our monthly profit switch “strategy” (which oscillates up and down) and the black ball is our net equity. Our scheme is to get the ball “off” the green staircase at the right time, jump onto the yellow staircase, and by doing so we eventually move up the staircase (our equity increases). Not exactly the same situation, but maybe it kinda sorta explains what we are doing by turning a profitable strategy (not unprofitable like yellow staircase) on and off with the monthly switch.
https://www.youtube.com/watch?v=cEuyfD2qVgQ (I don’t think it is an “optical illusion” as the video narrator says, though)
https://www.cut-the-knot.org/ctk/Parrondo.shtml
https://en.wikipedia.org/wiki/Parrondo%27s_paradox
That’s it for Part 1. In Part 2, we’ll try this exercise with an Average True Range based profit/loss switch, as opposed to a dollar based one. We’ll see if we get the same results…
If you haven’t read Part 1 yet, I encourage you to go and read it first. Otherwise, none of part 2 will make any sense to you.
In Part 2, instead of a fixed dollar amount for monthly stop loss or profit target, I will instead try stop/target amount based on Average True Range. Since a lot of traders like 3*ATR for individual trades, I’ll try 10*ATR and 25*ATR as exiting points. I have no idea if these are too big or too small, so I’ll test and see! This adds another 1,470,000 unique iterations to the test total.
The modified code for the ATR approach looks like this (code changes in bold):
If IMonthly=1 then Begin
CanTradeMonthly=True;
End;
If IMonthly=2 and CurrentEquity - NewMonthEquity < -10*AvgTrueRange(15)*BigPointValue then Begin
CanTradeMonthly=False;
End;
If IMonthly=3 and CurrentEquity - NewMonthEquity < -25*AvgTrueRange(15)*BigPointValue then Begin
CanTradeMonthly=False;
End;
If IMonthly=4 and CurrentEquity - NewMonthEquity > 10*AvgTrueRange(15)*BigPointValue then Begin
CanTradeMonthly=False;
End;
If IMonthly=5 and CurrentEquity - NewMonthEquity > 25*AvgTrueRange(15)*BigPointValue then Begin
CanTradeMonthly=False;
End;
And here are the results for the Monthly Loss approach for the Base strategies and the Reverse Base strategies:
Base Strategies:
As before, I am using the Reverse strategies to confirm/counter the possible conclusions from the Base strategies.
Reverse Strategies:
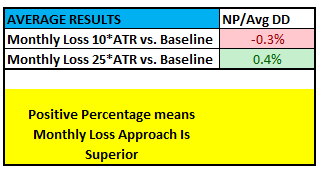
The results show that the monthly loss approach does not help for either the base or reverse strategies, and generally makes performance worse (or the same).
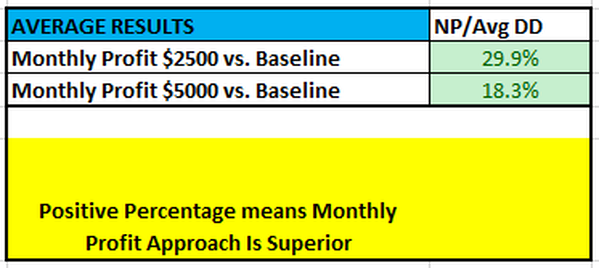
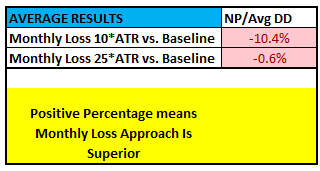
And here are the results for the Monthly Profit approach for the Base strategies and the Reverse Base strategies.
Base Strategies:
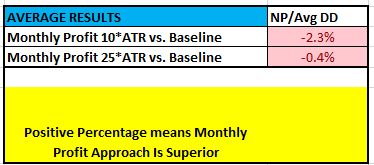
Reverse Strategies:
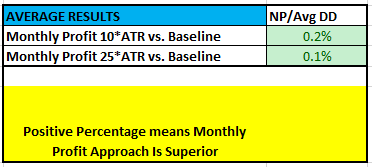
All these results are close to zero, so I’d conclude that the 10*ATR and 25*ATR profit switch do not help the cause.
So, with either the monthly loss switch or the monthly profit switch, the ATR approach does not help. Now, that could be because of my choice of ATR multipliers. I picked 10*ATR and 25*ATR because they felt reasonable, but I have no idea if they are any good.
That brings up a bigger point – why I have never really found ATR based stops and targets useful. Everyone pretty much says that you should use Average True Range instead of Dollars per contract. It makes sense, but never seems to work. Is it just me?
Additionally, the whole ATR concept is hard to wrap my head around. I understand that it is a proxy for volatility, and that in theory volatility measurements should adapt and fit the market better, but my experience is different. But sometimes the ATR amounts, when converted to Dollars, is ridiculously small or exceedingly large.
I’ve always had more success with dollar based stops and targets. Maybe it is just me, I don’t know. (Feel free to comment below or send me an e-mail: have you had more success with dollar based stops/targets, or Average True Range (ATR) based values?)
Given that the 10*ATR and 25*ATR results are poor, I decided to also test 3* ATR, 7*ATR, 50*ATR and 100*ATR. The results for those values are shown below, along with the original 10*ATR and 25*ATR results.
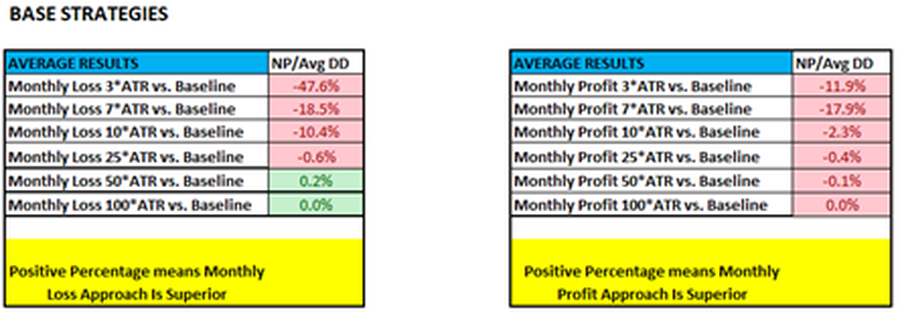
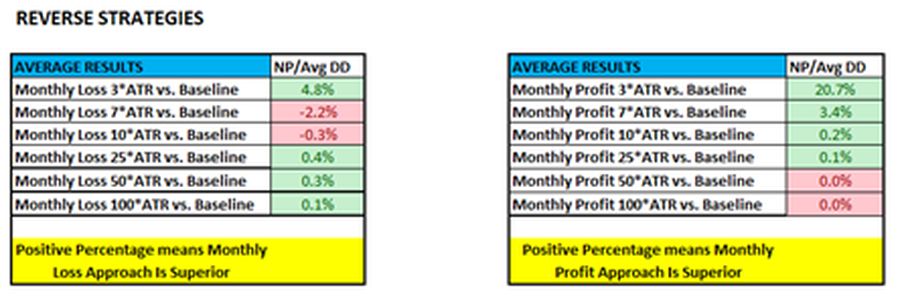
For the Base strategies, you can see that both the Monthly Loss approach and the Monthly Profit approach decrease strategy performance, regardless of ATR multiplier. As the ATR multiplier gets to 50 or 100, the impact is close to zero, suggesting that those ATR levels are never hit during trading.
For the Reverse strategies, the Monthly Profit approach is better, especially at low ATR multiplier values. But, since this finding is not confirmed with the Base strategies, I will say the results are inconclusive at best.
Overall, the conclusion on the ATR approach is this:
CONCLUSION #4: The ATR Multiplier approaches for Monthly Loss and Monthly Profit do not improve performance.
So at this point, the Dollar approach seems to have the best possibility for performance improvement. In Part 3, I’ll try to improve on that concept.
If you have read the earlier parts (Part 1 and Part 2) of this study, you will see that I have concluded that a Dollar Based Monthly Profit Exit is a possible viable approach to improving strategy performance on a risk adjusted basis.
But one small problem with the Part 1 results is that I treated all markets the same: A $2500 monthly loss in bigger markets like ES, GC, CL, and yet the same amount in smaller moving markets like FV, C, SB. This doesn’t seem right, do you agree? Part 3 fixes it, at least somewhat.
What I am going to do is to reduce all dollar amounts (monthly loss, monthly profit, stop loss, profit targets, trailing stops, etc) by 50% for instruments that do not have as much movement. I’ll use the 30 bar Average True Range (converted to dollars) for this measure. If the 30*ATR is less than $1000 per contract, then the dollar amounts in code will be reduced by 50%.
Here is what the Tradestation code for the monthly loss/profit switch is (the same concept holds for stops and targets in the strategies, but is not shown). Changes are in bold:
var:DollarMultiplier(0);
DollarMultiplier=1;
if AvgTrueRange(30)*BigPointValue<1000 then DollarMultiplier=.5;
If IMonthly=1 then Begin
CanTradeMonthly=True;
End;
If IMonthly=2 and CurrentEquity - NewMonthEquity < -2500*DollarMultiplier then Begin
CanTradeMonthly=False;
End;
If IMonthly=3 and CurrentEquity - NewMonthEquity < -5000*DollarMultiplier then Begin
CanTradeMonthly=False;
End;
If IMonthly=4 and CurrentEquity - NewMonthEquity > 2500*DollarMultiplier then Begin
CanTradeMonthly=False;
End;
If IMonthly=5 and CurrentEquity - NewMonthEquity > 5000*DollarMultiplier then Begin
CanTradeMonthly=False;
End;
As you can see, for the smaller movement markets, instead of $2500 and $5000 levels, the levels are now $1250 and $2500. Note that any market can have the smaller levels during times of low volatility. And it is not persistent – meaning the levels for any instrument can change day to day depending on volatility changes.
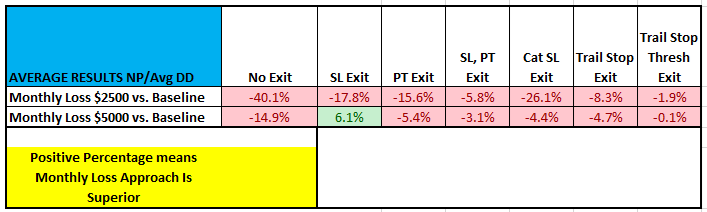
Let’s look at the monthly loss switch for the base and reverse strategies:
Base Strategies:
But one small problem with the Part 1 results is that I treated all markets the same: A $2500 monthly loss in bigger markets like ES, GC, CL, and yet the same amount in smaller moving markets like FV, C, SB. This doesn’t seem right, do you agree? Part 3 fixes it, at least somewhat.
What I am going to do is to reduce all dollar amounts (monthly loss, monthly profit, stop loss, profit targets, trailing stops, etc) by 50% for instruments that do not have as much movement. I’ll use the 30 bar Average True Range (converted to dollars) for this measure. If the 30*ATR is less than $1000 per contract, then the dollar amounts in code will be reduced by 50%.
Here is what the Tradestation code for the monthly loss/profit switch is (the same concept holds for stops and targets in the strategies, but is not shown). Changes are in bold:
var:DollarMultiplier(0);
DollarMultiplier=1;
if AvgTrueRange(30)*BigPointValue<1000 then DollarMultiplier=.5;
If IMonthly=1 then Begin
CanTradeMonthly=True;
End;
If IMonthly=2 and CurrentEquity - NewMonthEquity < -2500*DollarMultiplier then Begin
CanTradeMonthly=False;
End;
If IMonthly=3 and CurrentEquity - NewMonthEquity < -5000*DollarMultiplier then Begin
CanTradeMonthly=False;
End;
If IMonthly=4 and CurrentEquity - NewMonthEquity > 2500*DollarMultiplier then Begin
CanTradeMonthly=False;
End;
If IMonthly=5 and CurrentEquity - NewMonthEquity > 5000*DollarMultiplier then Begin
CanTradeMonthly=False;
End;
As you can see, for the smaller movement markets, instead of $2500 and $5000 levels, the levels are now $1250 and $2500. Note that any market can have the smaller levels during times of low volatility. And it is not persistent – meaning the levels for any instrument can change day to day depending on volatility changes.
Let’s look at the monthly loss switch for the base and reverse strategies:
Base Strategies:
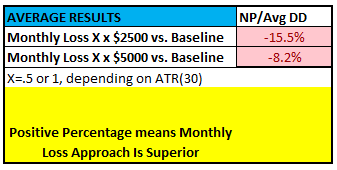
Reverse Strategies:
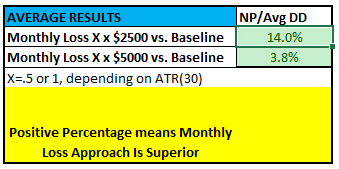
The Base and Reverse strategy results conflict for the Monthly Loss. The Base strategies get worse, but the Reverse strategies improve. But as I mentioned earlier, since the results conflict, I conclude there is no significant difference. At least, any difference in performance is not very relaible.
Now let’s take a look at the Profit Switch.
Base Strategies:
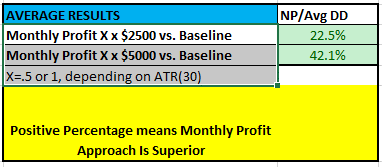
Reverse Strategies:
Both situations show improvement, so I conclude that the Monthly Profit switch does improve the performance.
Now, we have to compare it to Part 1 results, to see if the Part 3 changes are better than Part 1:
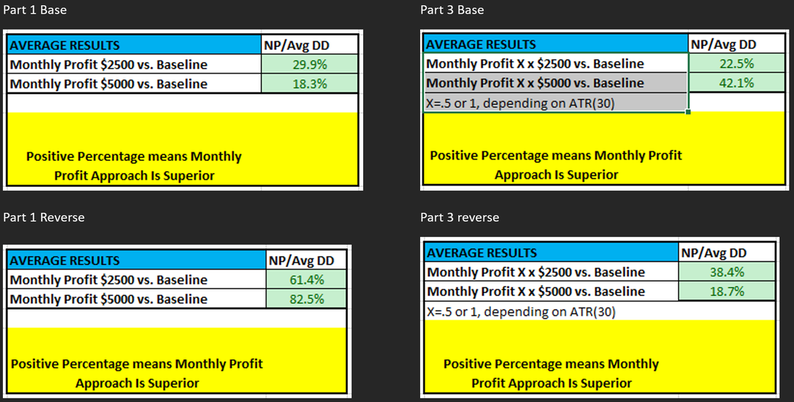
In 3 of the 4 comparisons, the Part 1 results are better than the Part 3 modifications. Only the Base strategies with $5000 Monthly Profit do better with the Part 3 modifications.
Even though the data does not support levels based on ATR multiplier, I still like it. But sometimes what I like is not what the market is willing to provide!
CONCLUSION #5: An ATR Adjustment to Monthly Profit Switch is Good (Part 3), But No ATR Adjustment is Better (Part 1)
Now, why don’t we make the monthly profit amount a variable in our walkforward code? Maybe that will improve things even more?
As an additional test, let’s take a look at varying the Monthly Profit Exit in the walkforward code. Up until this point, we tested $2500 or $5000 profit per contract as our exit point. Maybe allowing a variable amount (that will change with walkforward testing through history) will be better?
For this approach to be better, I’d expect a big improvement in performance, especially since it is using additional walkforward optimized inputs.
Here are the results, with the 2 best exits we tested: No exit (stop and reverse) and Catastrophic Stop of $5,000:
For this approach to be better, I’d expect a big improvement in performance, especially since it is using additional walkforward optimized inputs.
Here are the results, with the 2 best exits we tested: No exit (stop and reverse) and Catastrophic Stop of $5,000:
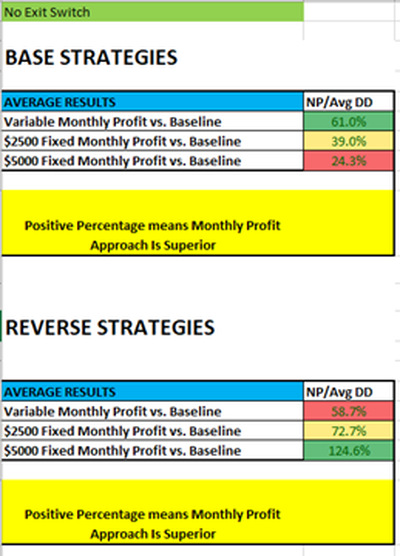
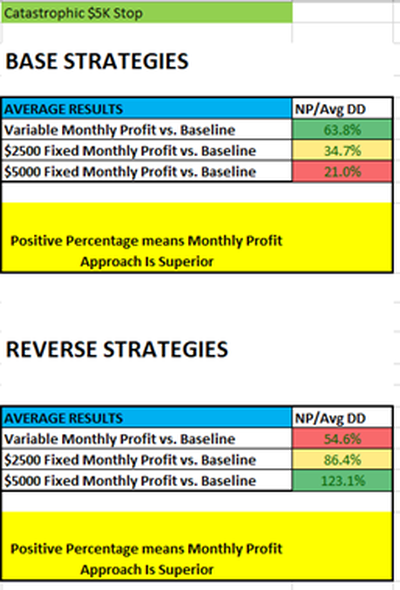
For the Base Strategies, the Variable Monthly Profit is better for both exits. NICE! Unfortunately, looking at the Reverse Strategies (our confirmation test), the results are flipped. The $5K Monthly Profit Exit is best for the Reverse Strategies.
Since the results are conflicting, I have to conclude that adding this Variable Monthly Profit is not worth it – especially since using it requires an extra parameter to optimize. I always vote for simplicity and less optimization, unless the differences are just too big to ignore.
CONCLUSION #6: A Variable Dollar Based Monthly Profit Switch Does Not Improve Performance Enough To Justify Having It
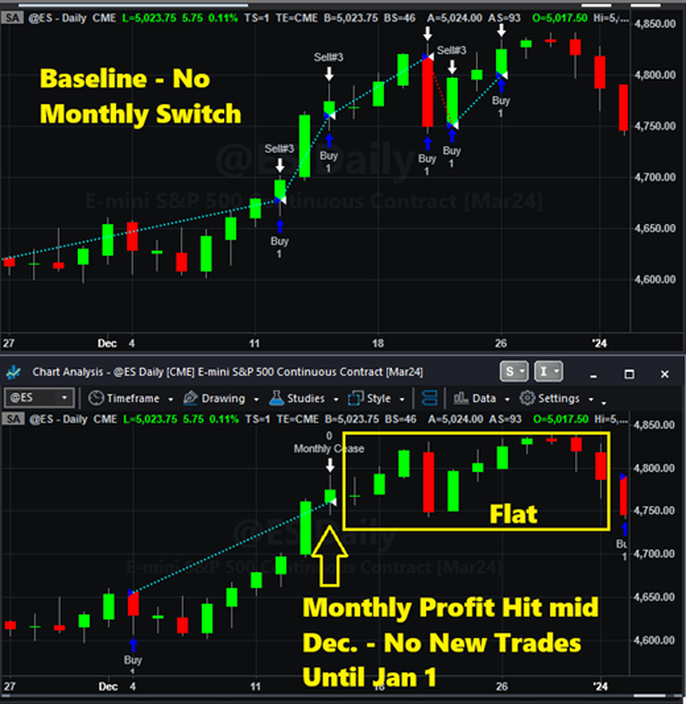
If you recall, the whole idea with this approach was to begin trading at the start of the month, then if a certain profit or loss was hit during the month, then turn the strategy off for the remainder of the month.
A few readers pointed out that such an approach had a few potential flaws:
These are legitimate points, so for Part 5 I thought I’d test their effects. To do this, I had to change the code (not shown) to turn off the strategy for at least 15 trading days, possibly up to 21 trading days. When turned off, the strategy would remain off regardless of change in month, and would never be off for only a few days.
Here are the results for this change.
A few readers pointed out that such an approach had a few potential flaws:
- Maybe the impact of the on/off switch was a seasonal/monthly type effect, where it would be better to just not trade during latter portions of the month
- If the profit/loss is hit on day 1, then the strategy is off almost the whole month. But if the profit/loss is hit on 2nd last day of month, then the strategy is only turned off for 1 day.
These are legitimate points, so for Part 5 I thought I’d test their effects. To do this, I had to change the code (not shown) to turn off the strategy for at least 15 trading days, possibly up to 21 trading days. When turned off, the strategy would remain off regardless of change in month, and would never be off for only a few days.
Here are the results for this change.
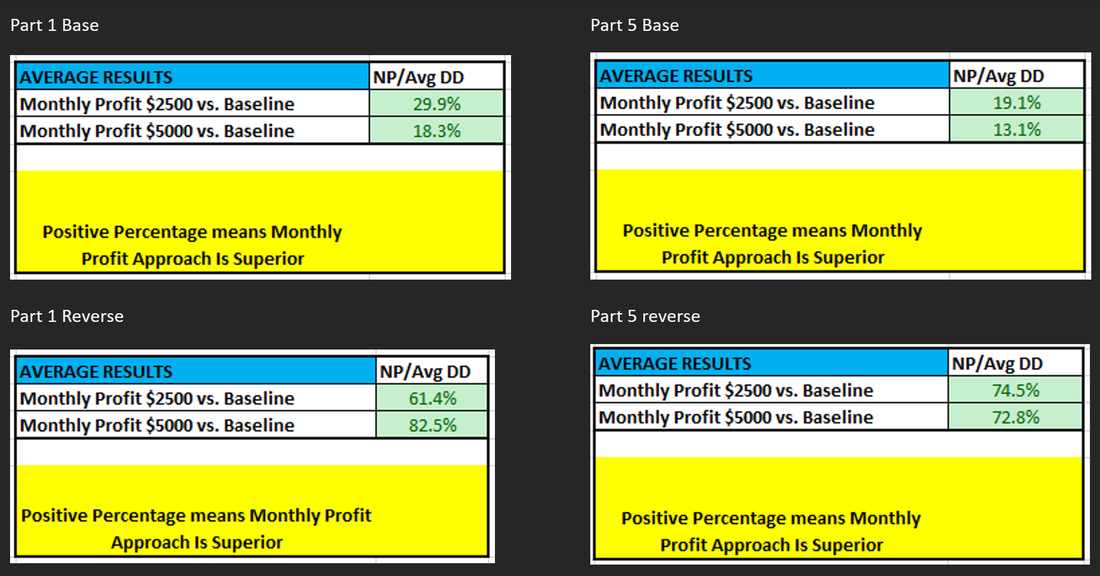
In 3 of the 4 comparisons, the Part 1 results are better than the Part 5 modifications. Only the Reverse strategies with $2500 Monthly Profit do better with the Part 5 modifications.
CONCLUSION #7: A Modified Monthly Approach Does Not Improve Performance Enough To Justify Having It
If you are still reading at this point, congratulations (and thank you!). This study has gone down a lot of paths, most of which have turned out to fruitless. But that is what testing is all about, isn’t it? Seeing what works and doesn’t work.
In that respect, the months I spent testing were definitely worth it. Sometimes finding out what doesn't work is a good thing, too!
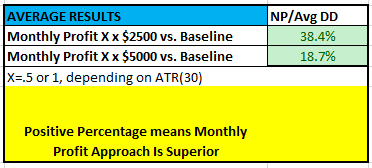
So, let’s summarize everything in this handy table:
In that respect, the months I spent testing were definitely worth it. Sometimes finding out what doesn't work is a good thing, too!
So, let’s summarize everything in this handy table:
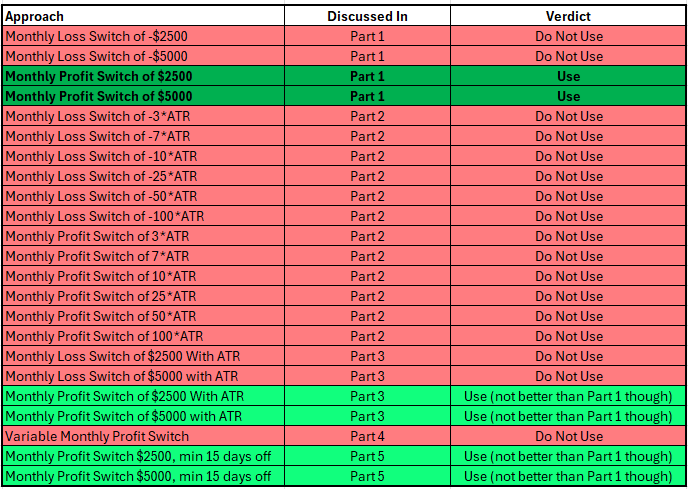
Going forward, I am going to use the approach in green, a monthly profit switch of $5000, although I will also look to use a $2500 or smaller threshold depending on the situation. For example, if I were to test infrequently traded intraday strategies, I might use a $1250 threshold. But with an always in strategy, $5000 would be appropriate.
The code I would include in strategies is shown below.
var: CurrentEquity(0),CurrentMonth(0),NewMonthEquity(0);
CurrentEquity = NetProfit + OpenPositionProfit;
CurrentMonth = Month(date);
If CurrentMonth<>CurrentMonth[1] then Begin
NewMonthEquity = CurrentEquity[1];
end;
Var:CanTradeMonthly(False);
CanTradeMonthly=True;
If CurrentEquity - NewMonthEquity > 5000 then Begin
CanTradeMonthly=False;
End;
//close any open trades if monthly switch is hit
If CanTradeMonthly=false then Begin
sell ("Monthly Cease") next bar at market;
buytocover ("Monthly Cease2") next bar at market;
End;
//note all entries need to be wrapped in this IF block to trade only when allowed
If CanTradeMonthly then Begin
…entries here
End;
ONE FINAL NOTE: After running this whole study, I took a few different strategies than what I used in this study, and ran a few thousand cases. The results again showed this monthly profit switch improved risk adjusted performance. Not a rigorous validation by any means, but something nice to know!
I hope you have found this study useful, and I hope you develop better strategies because of it. Let me know in the comments below!
Comment Form is loading comments...

About The Author: Kevin Davey is an award winning private futures, forex and commodities trader. He has been trading for over 30 years. Three consecutive years, Kevin achieved over 100% annual returns in a real time, real money, year long trading contest, finishing in first or second place each of those years.
Kevin is the author of 5 highly acclaimed books: https://www.amazon.com/stores/Kevin-J-Davey/author/B00J34ZNPQ Kevin has won numerous industry awards for his real money trading and his algo trading teaching. Kevin provides a wealth of trading information at his website: https://kjtradingsystems.com
Copyright, Kevin Davey and KJ Trading Systems. All Rights Reserved. Reprint of above article is permitted, as long as the About The Author information is included.