
How To Trade Multiple Algo Strategies On The Same Instrument
Last Updated, September 2022
Tradestation is a pretty amazing testing and development platform. I’ve been using it for over 10 years, and I’ve been very happy overall with it. Sure, there are certain aspects of it I don’t like, and certain things that are hard to do, but I think that is true of almost any platform.
My biggest pet peeve with Tradestation is that it is hard to trade 2 automated strategies (trading multiple strategies) in the same market at the same time. Why is this even important? Why not just trade the best strategy, and shelve the one that does not perform as well? Many people do just that; unfortunately they usually pick the wrong strategy to trade!
I take the opposite approach in my trading – I assume that I don’t know what strategy will perform best in the next 6 months, or at any point in the future. Plus, I also assume that all strategies will eventually break, and have to be retired. So, I want plenty of strategies for each market, and I want to trade them all. This leads to diversification, which has been known for years to smooth out the overall equity curve.
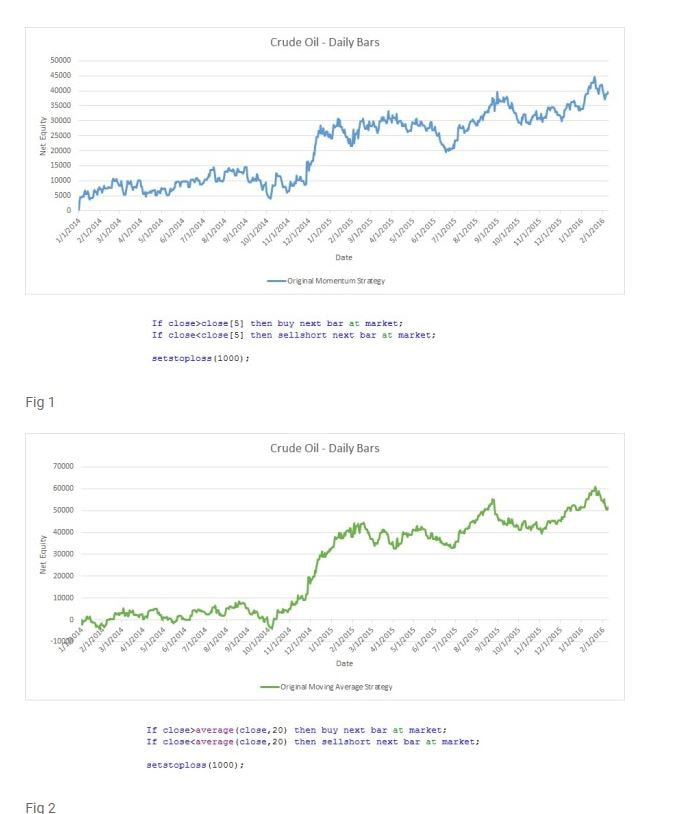
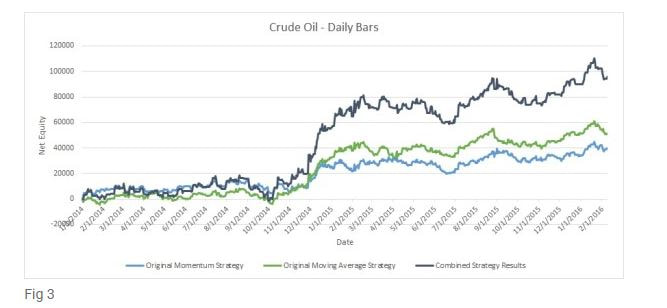
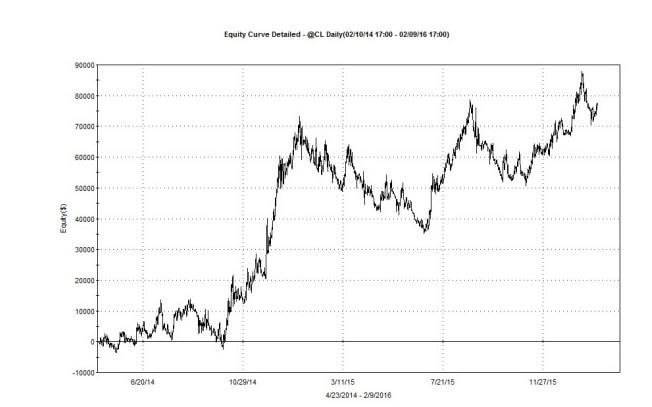
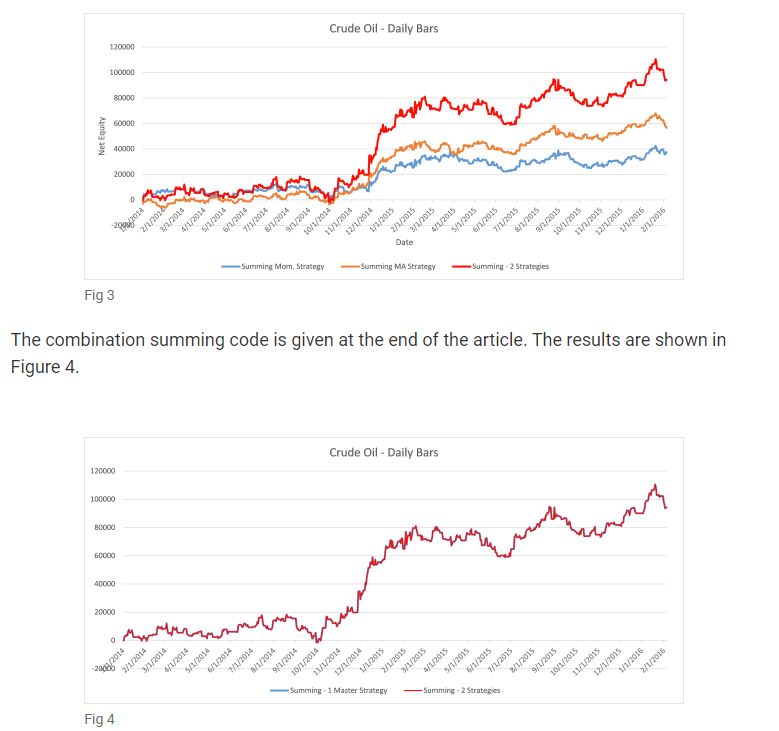
With that in mind, consider the equity curves and code for two very simple strategies. Shown in Figure 1 is a momentum strategy, and Figure 2 depicts a simple moving average system. Both are applied to daily Crude Oil bars for the past few years, and do not include slippage or commissions. If you traded both at the same time, you’d want the equity curve to look like Figure 3, which is just the daily sum of the two strategies.
Tradestation is a pretty amazing testing and development platform. I’ve been using it for over 10 years, and I’ve been very happy overall with it. Sure, there are certain aspects of it I don’t like, and certain things that are hard to do, but I think that is true of almost any platform.
My biggest pet peeve with Tradestation is that it is hard to trade 2 automated strategies (trading multiple strategies) in the same market at the same time. Why is this even important? Why not just trade the best strategy, and shelve the one that does not perform as well? Many people do just that; unfortunately they usually pick the wrong strategy to trade!
I take the opposite approach in my trading – I assume that I don’t know what strategy will perform best in the next 6 months, or at any point in the future. Plus, I also assume that all strategies will eventually break, and have to be retired. So, I want plenty of strategies for each market, and I want to trade them all. This leads to diversification, which has been known for years to smooth out the overall equity curve.
With that in mind, consider the equity curves and code for two very simple strategies. Shown in Figure 1 is a momentum strategy, and Figure 2 depicts a simple moving average system. Both are applied to daily Crude Oil bars for the past few years, and do not include slippage or commissions. If you traded both at the same time, you’d want the equity curve to look like Figure 3, which is just the daily sum of the two strategies.
Multiple Algorithmic Trading Strategies
So, how could you do this – trade multiple strategies in the same market at the same time- in Tradestation? There are quite a few options to do this. Unfortunately, all have advantages and, most importantly, disadvantages.
Option 0 - I call this Option 0 because it is the first thing you should try - IF you are using Tradestation 10. If you are using Tradestation 9.5, definitely use one of the options below. But Tradestation has made improvements in version 10, and the platform seems to handle trading in multiple strategies, with the same instrument and same account, a whole lot better. Now, I can't say it is totally foolproof, but I will say my own experience and the experience of Strategy Factory students so far has been good. It works a TON better now!
So, I'd say first try trading multiple strategies (1 per chart) in version 10, and see if that solves your problem. If it doesn't, or if you aren't using version 10, try one of the options below.
Currently, I am successfully using Option 0, Option 4 and Option 5.
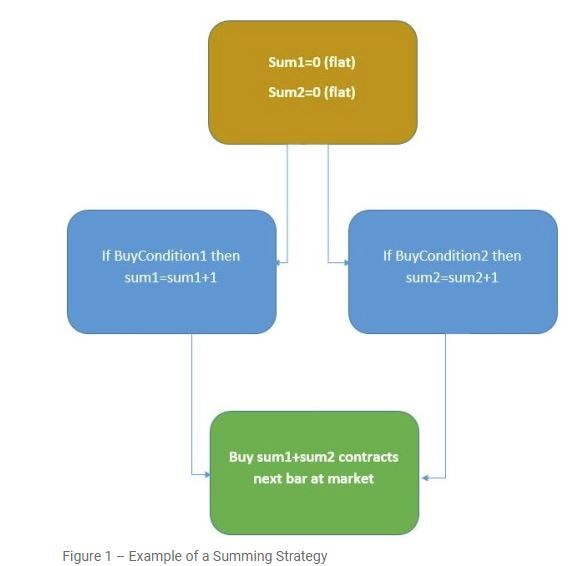
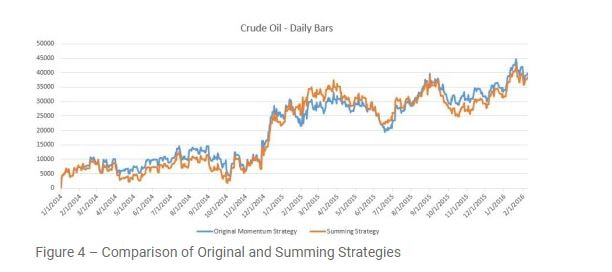
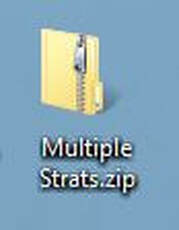
Option 1 would be to insert the two strategies on the same chart. That leads to decent results in this particular case, as shown in Figure 4. But, it does not equal the equity curve we want (although in this case it is fairly similar), shown earlier in Figure 3. In general, this is not a good alternative. Too many times, inserting two strategies on the same chart will lead to terrible results.
Option 0 - I call this Option 0 because it is the first thing you should try - IF you are using Tradestation 10. If you are using Tradestation 9.5, definitely use one of the options below. But Tradestation has made improvements in version 10, and the platform seems to handle trading in multiple strategies, with the same instrument and same account, a whole lot better. Now, I can't say it is totally foolproof, but I will say my own experience and the experience of Strategy Factory students so far has been good. It works a TON better now!
So, I'd say first try trading multiple strategies (1 per chart) in version 10, and see if that solves your problem. If it doesn't, or if you aren't using version 10, try one of the options below.
Currently, I am successfully using Option 0, Option 4 and Option 5.
Option 1 would be to insert the two strategies on the same chart. That leads to decent results in this particular case, as shown in Figure 4. But, it does not equal the equity curve we want (although in this case it is fairly similar), shown earlier in Figure 3. In general, this is not a good alternative. Too many times, inserting two strategies on the same chart will lead to terrible results.
Option 2 would be to combine the code for each strategy into one “super code” and trade that. The code for each would be cut and pasted into the “master” code, with no changes at all. With this technique, however, the resulting strategy still does not mimic the curve we want. This is especially true if the strategy uses Tradestation reserved words, such as openpositionprofit and market position. This method is just another disappointment.
Option 3 is to trade each strategy, in a separate chart, in the same account. Depending on the code, though, this option can be fraught with disaster. For example, you cannot use the Trade Manager Position Match feature any longer, so you’ll never know if your real life positions match both strategies. And that is just the tip of the iceberg. Stop losses, market position based rules and many other nuances in Tradestation make this a very difficult alternative. The end result with this option, based on my personal trading experience, is that it just is not a feasible option. As can you see by now, trading multiple algo strategies in the same account is not always easy!
Option 4 is to trade each strategy in its own chart window, and use a third party tool to manage or enter the positions. This is a good solution, but there is a fee for this 3rd party software. Some possible software packages that may help you with this option:
http://www.traderssoft.com/wp/ts/software/software-ts9/
http://www.ninjatrader.com
Of the two, I have only used the Ninjatrader option to send orders from Tradestation thru Ninja to another broker (although unless you have an old Ninja license, your current choice of brokers is somewhat limited). But, I did not use this interface specifically to trade multiple strategies with one instrument. One of these solutions may work for your particular case.
Option 5 is to trade each strategy in its own chart, in its own account. So, if I had 3 ES strategies, I would trade each strategy in a separate account, meaning I’d need 3 accounts. This is the method I have primarily used. It has its advantages – it makes bookkeeping each strategy a bit easier, and the strategies can be tracked fairly easily in Tradestation’s Trade Manager.
But, the approach also has its downside. For instance, it is a very non-optimal way to use margin. If I go long in one account 1 contract of ES, that ties up $5060 in margin. And if I go short 1 ES in another account, it would tie up another $5060. So, I end up with 2 positions, in opposite directions, meaning in reality I am net flat, and instead of needing $10,120 in margin, I should need $0!
Although there may be other potential solutions to the problem, I am going to with Option 6. This solution involves summing up position in multiple strategies, and then just trading to reach the net position. For example, if strategy #1 was long, that would be +1. If strategy #2 was also long, that would be +1 also. Summed up, that would mean you should be +2, or long 2 contracts.
The nice thing about this solution is that you could potentially trade many strategies at the same time, and have the result traded through and depicted on only one chart. So, each individual strategy could be evaluated separately (using the Strategy Factory process I teach for example), and then it could be “added” to other profitable strategies.
In theory, that seems like an easy proposition. Just sum up positions, and trade the net. But, reality is quite a bit tougher, due to the way Tradestation works, and also just due to the nature of the problem.
In the next installment of this series, we will take the first step towards creating a “super” strategy that trades 2 strategies – creating strategies that perform similarly to the original strategies of Figure 1 and 2, but that will lend themselves to being combined into the super, master strategy.
Multiple Trading Strategies in a Platform
Part 2
In Part 1, I discussed the need for trading multiple strategies with the same instrument in the same account. This type of capability is very important to a trader who wishes to trade a diversified portfolio, while at the same time efficiently managing margin. Unfortunately, one of the limitations of Tradestation, my trading platform of choice, is that this capability is very tough to achieve.
As you will recall from the earlier article, we discussed six different options to trade multiple strategies with the same instrument. In this article, we will layout the process and the code to create a summing strategy, which was Option number 6. The steps to take in such an approach are as follows:
- Create a typical strategy, using standard Tradestation reserved words such as “setstoploss”
- Transform this typical strategy into a “summing” strategy. An example of how a summing strategy works is shown in Part 2, Figure 1:
- Check that summing strategy matches the original strategy
- Combine multiple summing strategies into a master strategy
Now I will focus on the first three steps, and the final part 3 of the article will focus on the fourth step.
For the baseline normal strategy we will just use the simple strategy described in part 1 – a simple momentum strategy with a stoploss. No breakeven stops here! This is typical of a very simple strategy. We will not include a profit target, but the conversion process from a typical strategy to a summing strategy could easily handle this. This simple strategy produces the equity curve shown in Part 2, Figure 2.
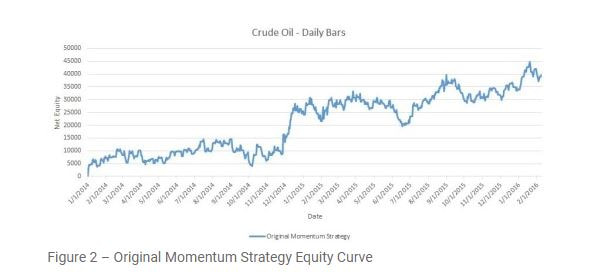
This is the curve we will try to mimic with the summing strategy. It is important to note that we say “mimic” and not “duplicate.” For example, for various reasons it is not possible to correctly use Tradestation stoploss functions when combining multiple strategies. So, we will attempt to get close to the original strategy, but the summing strategy performance may be better, or it may be worse. That is the price we must pay to reach the end objective.
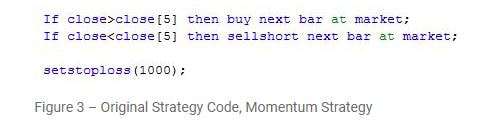
In looking at the original strategy, the entry – a simple “buy the next bar at market” – should be fairly easy to implement. The stop loss order will be a bit more difficult. This is because the stop loss is active the whole bar, and the new strategy will only act at end of bars.
To keep the conversion simple, I am going to use “sell next bar at market” to replicate the stops. This will mean there is no stop in the market when you actually trade it live. This could be a deal breaker for some people, but in reality the difference between using actual stop losses and simply exiting the next bar at market is not troublesome in most strategies. If it is significant, the pseudo stop price can be adjusted to more closely match the original strategy. Again, though, we are giving up the power of the stoploss function to be able to more easily create the summing strategy.
Part 2 Figure 3 shows the original strategy created for step 1.
Below shows the summing strategy created for step 2.
//******************************************************
{Summing strategy, designed to combine with other strategies
By Kevin J. Davey
www.kjtradingsystems.com
[email protected]}
{TRY TO MIMIC THIS
If close>close[5] then buy next bar at market;
If close<close[5] then sellshort next bar at market;
setstoploss(1000);}
input: stopl(1000),ncons01(1);
var: PositionAtEnd01(0),LongEntry(0),ShortEntry(0);
//this is the current position we should be at the start of the bar
//PositionAtEnd01[1];
//Entry rule
// If Condition1 then begin Condition1 is your buy signal
If close>close[5] then begin
PositionAtEnd01=1; //should be long at open of next bar
If PositionAtEnd01[1]<>1 then LongEntry=Close-stopl/BigPointValue; //reset longentry only if New trade
End;
// If Condition2 then begin Condition2 is your sellshort signal
If close<close[5] then begin
PositionAtEnd01=-1; //should be short at open of next bar
If PositionAtEnd01[1]<>-1 then ShortEntry=Close+stopl/BigPointValue; //reset shortentry only if New trade
End;
//now check current position and see if pseudo stop was hit- if it was, then make sure position at open of next bar is flat
If (positionAtEnd01[1]=1 ) and Close<=LongEntry then PositionAtEnd01=0;
If (positionAtEnd01[1]=-1 ) and Close>=ShortEntry then PositionAtEnd01=0;
//now at this point, we have three possibilities
//PositionAtEnd01=1 means at open of next bar, we should be LONG ncons01 contracts
//PositionAtEnd01=-1 means at open of next bar, we should be SHORT ncons01 contracts
//PositionAtEnd01=0 means at open of next bar, we should be FLAT
//***********************************************
//we have to figure out how many long or short we should be
var:totalcons(0),currentcons(0),constobuy(0),constosellshort(0);
totalcons=0;
If PositionAtEnd01=1 then totalcons=ncons01;
If PositionAtEnd01=-1 then totalcons=-ncons01;
//so now totalcons should be the final position, after all is said and done
CurrentCons=CurrentContracts*Marketposition; //this is our current posirion at the close of the current bar
//print(date," ",totalcons," ",currentcons);
//first figure out how many contracts to buy or sell to get to right NET LONG position
constobuy=0;
If TotalCons>0 then begin
If currentcons<=0 then constobuy= totalcons;
If currentcons>0 then begin
//we are long, but have to decrease our long position (but still stay long)
if totalcons<currentcons then begin Sell currentcontracts-totalcons contracts total next bar at market;
end;
If totalcons>currentcons then constobuy= totalcons-currentcons;
end;
buy constobuy contracts next bar at market;
end;
//next figure out how many contracts to buy or sell to get to right NET SHORT position
constosellshort=0;
If TotalCons<0 then begin
If currentcons>=0 then constosellshort= -totalcons;
If currentcons<0 then begin
if totalcons>currentcons then begin
//we are short, but have to decrease our short position (but still stay Short)
Buytocover (currentcontracts+totalcons) contracts total next bar at market;
end;
If totalcons<currentcons then constosellshort= -(totalcons-currentcons) ;
end;
sellshort constosellshort contracts next bar at market;
end;
//if we should be flat overall, then exit all existing contracts
If TotalCons=0 then Sell All contracts next bar at market;
If TotalCons=0 then BuyToCover All contracts next bar at market;
By examining the code, it should be pretty clear what is going on – order statements like “buy next bar at market” are replaced with counters/summing variables, and at the end of the code, the counters/summing variables are converted back into buy and sell statements.
Some of the code for the bottom section looks overly complex, and it is that way by necessity. Tradestation has some weird quirks with order placement that must be accounted for. For example, let’s say you have a strategy with two separate buy statements triggered, corresponding to different conditions. So, now you’d be long two contracts, one from each entry. If you later wanted to exit (sell) only one of these contracts, a statement such as “sell 1 contract next bar at market;” will actually sell one contract from each entry.
So, the architecture of Tradestation makes keeping track of orders and where they come from pretty difficult. Thus, the code at the bottom of the summing strategy is complicated. In the end, the accuracy of this code can be determined by comparing the individual summing strategies with the single “master” summing strategy. That will be demonstrated in part 3.
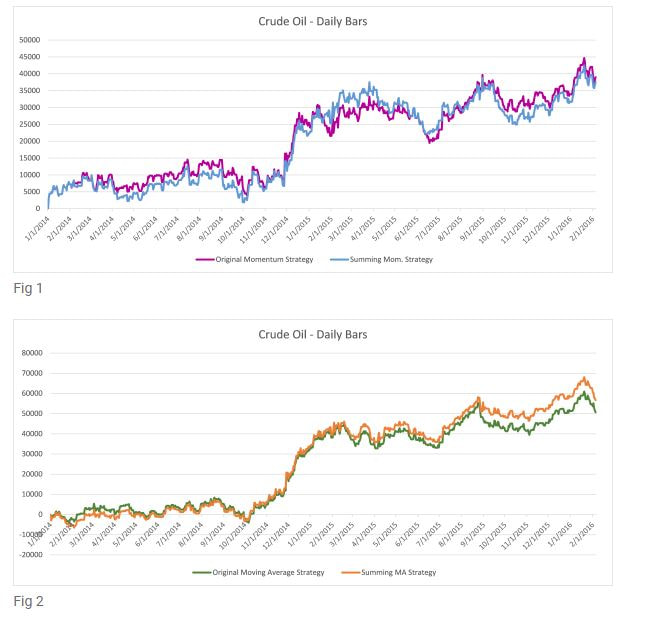
Part 2 Figure 4 shows the equity curve for each of the strategies. As you can see, the results are fairly similar – close enough for us to accept the summing strategy of Figure 4 in lieu of the original strategy of Part 2 Figure 3.
//******************************************************
{Summing strategy, designed to combine with other strategies
By Kevin J. Davey
www.kjtradingsystems.com
[email protected]}
{TRY TO MIMIC THIS
If close>close[5] then buy next bar at market;
If close<close[5] then sellshort next bar at market;
setstoploss(1000);}
input: stopl(1000),ncons01(1);
var: PositionAtEnd01(0),LongEntry(0),ShortEntry(0);
//this is the current position we should be at the start of the bar
//PositionAtEnd01[1];
//Entry rule
// If Condition1 then begin Condition1 is your buy signal
If close>close[5] then begin
PositionAtEnd01=1; //should be long at open of next bar
If PositionAtEnd01[1]<>1 then LongEntry=Close-stopl/BigPointValue; //reset longentry only if New trade
End;
// If Condition2 then begin Condition2 is your sellshort signal
If close<close[5] then begin
PositionAtEnd01=-1; //should be short at open of next bar
If PositionAtEnd01[1]<>-1 then ShortEntry=Close+stopl/BigPointValue; //reset shortentry only if New trade
End;
//now check current position and see if pseudo stop was hit- if it was, then make sure position at open of next bar is flat
If (positionAtEnd01[1]=1 ) and Close<=LongEntry then PositionAtEnd01=0;
If (positionAtEnd01[1]=-1 ) and Close>=ShortEntry then PositionAtEnd01=0;
//now at this point, we have three possibilities
//PositionAtEnd01=1 means at open of next bar, we should be LONG ncons01 contracts
//PositionAtEnd01=-1 means at open of next bar, we should be SHORT ncons01 contracts
//PositionAtEnd01=0 means at open of next bar, we should be FLAT
//***********************************************
//we have to figure out how many long or short we should be
var:totalcons(0),currentcons(0),constobuy(0),constosellshort(0);
totalcons=0;
If PositionAtEnd01=1 then totalcons=ncons01;
If PositionAtEnd01=-1 then totalcons=-ncons01;
//so now totalcons should be the final position, after all is said and done
CurrentCons=CurrentContracts*Marketposition; //this is our current posirion at the close of the current bar
//print(date," ",totalcons," ",currentcons);
//first figure out how many contracts to buy or sell to get to right NET LONG position
constobuy=0;
If TotalCons>0 then begin
If currentcons<=0 then constobuy= totalcons;
If currentcons>0 then begin
//we are long, but have to decrease our long position (but still stay long)
if totalcons<currentcons then begin Sell currentcontracts-totalcons contracts total next bar at market;
end;
If totalcons>currentcons then constobuy= totalcons-currentcons;
end;
buy constobuy contracts next bar at market;
end;
//next figure out how many contracts to buy or sell to get to right NET SHORT position
constosellshort=0;
If TotalCons<0 then begin
If currentcons>=0 then constosellshort= -totalcons;
If currentcons<0 then begin
if totalcons>currentcons then begin
//we are short, but have to decrease our short position (but still stay Short)
Buytocover (currentcontracts+totalcons) contracts total next bar at market;
end;
If totalcons<currentcons then constosellshort= -(totalcons-currentcons) ;
end;
sellshort constosellshort contracts next bar at market;
end;
//if we should be flat overall, then exit all existing contracts
If TotalCons=0 then Sell All contracts next bar at market;
If TotalCons=0 then BuyToCover All contracts next bar at market;
By examining the code, it should be pretty clear what is going on – order statements like “buy next bar at market” are replaced with counters/summing variables, and at the end of the code, the counters/summing variables are converted back into buy and sell statements.
Some of the code for the bottom section looks overly complex, and it is that way by necessity. Tradestation has some weird quirks with order placement that must be accounted for. For example, let’s say you have a strategy with two separate buy statements triggered, corresponding to different conditions. So, now you’d be long two contracts, one from each entry. If you later wanted to exit (sell) only one of these contracts, a statement such as “sell 1 contract next bar at market;” will actually sell one contract from each entry.
So, the architecture of Tradestation makes keeping track of orders and where they come from pretty difficult. Thus, the code at the bottom of the summing strategy is complicated. In the end, the accuracy of this code can be determined by comparing the individual summing strategies with the single “master” summing strategy. That will be demonstrated in part 3.
Part 2 Figure 4 shows the equity curve for each of the strategies. As you can see, the results are fairly similar – close enough for us to accept the summing strategy of Figure 4 in lieu of the original strategy of Part 2 Figure 3.
Eventually, as the trader gets more comfortable with this conversion process, he or she can start out from the beginning with the summing strategy, bypassing the original strategy completely. If this strategy produces acceptable performance results, there really is no need to create the original strategy. A sample template for an individual summing strategy is shown in the code at the bottom of the article.
Now that we can convert a “normal” strategy into a format that can work with a summing strategy, we can combine multiple strategies into one large strategy. That will be tackled in the final part of this article series.
Part 3
In the last parts, I discussed the need for trading multiple strategies with the same instrument in the same account. This type of capability is very important to a trader who wishes to trade a diversified portfolio, while at the same time efficiently managing margin. Unfortunately, with many platforms this capability is very tough to achieve.
One question that comes up is: how do I find different ideas for trading strategies? Well, my site and books have a ton of ideas! For example, here are 15 price patterns you can try.
Earlier in the article I introduced a template that could be used to convert a “standard” strategy into a strategy that could eventually be combined with other strategies, and produce the same overall performance that each strategy combined would produce.
Unfortunately, with that method, certain nice and arguably critical features (such as standard stop losses and profit targets) have to be replaced by alternatives (such as exiting next bar at open when a big loss is recognized at the bar close). But, if a trader is willing to accept these tradeoffs, he can obtain an equity curve which is very similar to the original strategy.
Since I previously demonstrated that this method produced acceptable results for one strategy, let’s see if we can combine two of these strategies into one strategy with similar performance.
To do that, we will combine a momentum strategy, shown in Figure 1, with a moving average strategy, shown in Part 3 Figure 2. These have already been converted into what I call a “summing” strategy – a strategy that can easily be combined with other similar strategies into one “master” strategy. Complete code for both systems is given at the end of the article.
Since there appears to be only one curve, it means the two results are identical – precisely what we wanted! So, this proves the summing template can be used effectively to trade two strategies in one “master strategy.” Plus, the method is not limited to two strategies – the developer can actually combine as many strategies as he or she desires.
One important note: In the example above, I assumed zero commissions and slippage. So, when you combine strategies, the results should be identical. In reality, though, with commissions and slippage the master strategy will actually have slightly better results, since occasionally conflicting trade signals will cancel out, instead of each being executed.
To recap the method:
The key to using this method effectively is to create the strategies from the start with the summing code. That is, create it with the end goal of adding it to other strategies. Then, you can run your standard development process (I use my rigorous Strategy Factory process to develop and fully test each strategy) on each component strategy. Once this is done, these component strategies can be added together to create one master strategy – one that will faithfully trade all strategies at the same time.
End Note: The workspace and strategy files at the bottom of the article demonstrate the complete concept. First, try running each of the summing strategies by itself. Then run strategies 1 and 2 together in that chart. You will see that the results look nothing like they should. Then run Master strategy 03. You will see that its results match strategy 1 plus the results of strategy 2.
If you'd like the source codes, you can download them by clicking on the image below.
One important note: In the example above, I assumed zero commissions and slippage. So, when you combine strategies, the results should be identical. In reality, though, with commissions and slippage the master strategy will actually have slightly better results, since occasionally conflicting trade signals will cancel out, instead of each being executed.
To recap the method:
- Create strategy number 1 in the summing strategy format given in part 2.
- Create strategy numbers 2-N in the summing format.
- Combine the N strategies together in a new strategy. Care must be taken to have different variable names associated with each strategy. One way to do this is to identify strategy number 1 variables with the suffix “01,” strategy number 2 with “02,” etc.
- Insert the master summing strategy created in step 3.
- Compare the equity curve of step 4 with the sum of equity curves of strategies in steps 1-2. This check ensures that the strategies were combined correctly.
- If the results are the same, then the strategy can safely be traded. Now you are trading two or more strategies with the same instrument in the same account! Tradestation Trade Manager can still be used to check that actual positions match the strategy.
The key to using this method effectively is to create the strategies from the start with the summing code. That is, create it with the end goal of adding it to other strategies. Then, you can run your standard development process (I use my rigorous Strategy Factory process to develop and fully test each strategy) on each component strategy. Once this is done, these component strategies can be added together to create one master strategy – one that will faithfully trade all strategies at the same time.
End Note: The workspace and strategy files at the bottom of the article demonstrate the complete concept. First, try running each of the summing strategies by itself. Then run strategies 1 and 2 together in that chart. You will see that the results look nothing like they should. Then run Master strategy 03. You will see that its results match strategy 1 plus the results of strategy 2.
If you'd like the source codes, you can download them by clicking on the image below.

About Author: Kevin Davey is an award winning private futures, forex and commodities trader. He has been trading for over 25 years.Three consecutive years, Kevin achieved over 100% annual returns in a real time, real money, year long trading contest, finishing in first or second place each of those years.
Kevin is the author of the highly acclaimed algorithmic trading book "Building Algorithmic Trading Systems: A Trader's Journey From Data Mining to Monte Carlo Simulation to Live Trading" (Wiley 2014). Kevin provides a wealth of trading information at his website: http://www.kjtradingsystems.com
Copyright, Kevin Davey and KJ Trading Systems. All Rights Reserved. Reprint of above article is permitted, as long as the About The Author information is included.