
Quick Exits In Algo Trading
|
Even though I have been algo trading for decades, every once in a while I come across something that makes me question what my algos are doing.
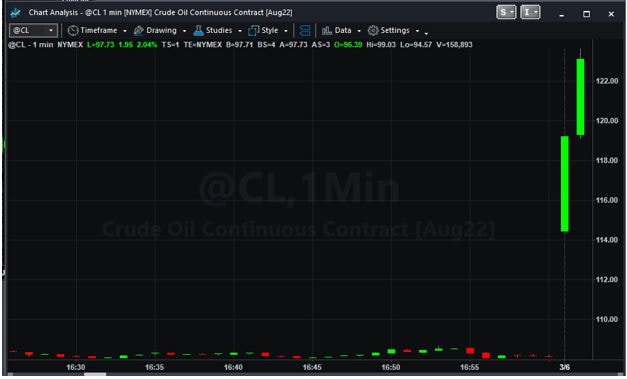
This question is centered around exiting a trade quickly. What does that mean? Simply put, when a trade moves in your favor quickly, you take advantage of it and exit. “Get while the getting is good” is an old time phrase that describes this. In other words, when you algo is given a big, quick profit, take it and go flat. Here is an example. This is from Sunday March 6, 2022. |
Crazy Price Action In Crude Oil!

The war in Ukraine was getting serious, and the price of oil skyrocketed. 2 minutes into Sunday night, the price of Crude Oil had jumped by as much as $15.50 per barrel. That is over $15,000 per contract, practically instantaneously!
I was long, and how I wished my algo would have exited right then and there. I mean really, how much higher could price go in the near term?
As it turned out, that was the peak, at least until the time I am writing this (Fall 2022). Those first few minutes of that Sunday night would have been the ideal time to exit.
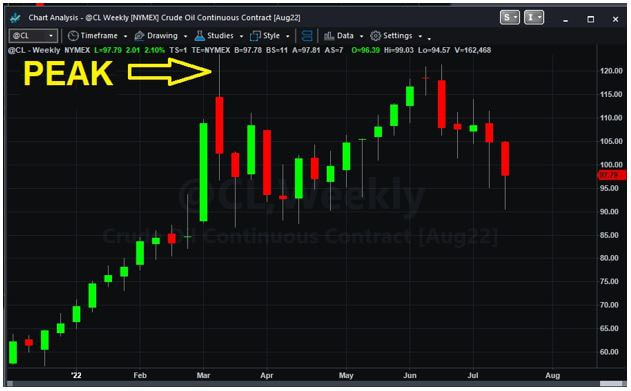
Best Algo Trading Exit - Was This The Best Time?
If only I had exited…
This got me to thinking. Maybe when prices pikes like this happen, could I set my algo strategies to exit at this peak time? Make the algos take advantage of these spikes, and “get out while the getting is good?”
There of course is a flipside to this. Maybe I only notice these occurrences because they happen infrequently, and I regret the missed profits the spike would have brought. There could be plenty of other times where there is a spike like this, and the market keeps going. In those cases, I’d miss out on a lot of profit.
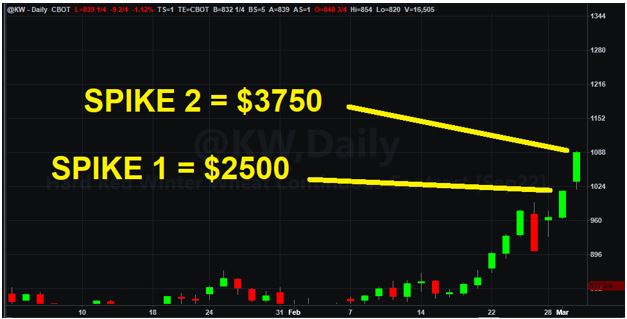
Here is an example of that situation, in Hard Red Winter Wheat, around the same time as the Crude Oil spike I showed earlier.
Both Spike 1 and Spike 2 below were big up spikes, and could have been excellent times to exit – if this peak spike idea has merit.
This got me to thinking. Maybe when prices pikes like this happen, could I set my algo strategies to exit at this peak time? Make the algos take advantage of these spikes, and “get out while the getting is good?”
There of course is a flipside to this. Maybe I only notice these occurrences because they happen infrequently, and I regret the missed profits the spike would have brought. There could be plenty of other times where there is a spike like this, and the market keeps going. In those cases, I’d miss out on a lot of profit.
Here is an example of that situation, in Hard Red Winter Wheat, around the same time as the Crude Oil spike I showed earlier.
Both Spike 1 and Spike 2 below were big up spikes, and could have been excellent times to exit – if this peak spike idea has merit.
But as it played out, those spike were really the start of a whole other leg up. Exiting at Spike 2 would have potentially left $10,000 on the table over the next 3 days!
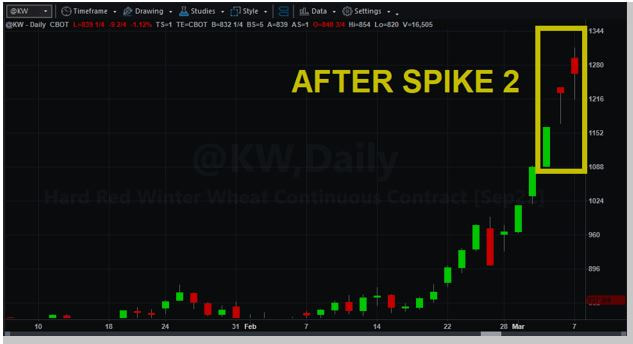
So maybe the spike idea isn’t all that good after all. And maybe it is. Who knows?
By now, if you’ve been following me for a while, you know where this is going. My solution, as always, is “I have to test.”
So, let’s test it then!
(If you don’t want all the details, just watch the summary video: https://youtu.be/Kn7GObiyy4w)
Algo Test Setup – Markets, Bar Sizes, Time Period
When I do an in-depth test like this, I usually test a wide array of US (and some European) based futures. All together, I am testing 54 futures markets.
// Symbols Data1: @AD,@BO,@BP,@BRN=105XC,@C,@CC,@CD,@CL,@CT,@DX,@EC,@ED,@ES.D,@ES,@FC,@FDAX,@FESX,@FGBL,@FGBM,@FGBS,@FGBX=108XC,@FSTB=108XC,@FSTU=108XC,@FV,@GC,@HG,@HO,@JY,@KC,@KW,@LB=108XC,@LC,@LH,@MP1,@NG,@NK,@NQ,@O,@OJ,@PA=105NC,@PL,@RB,@RR,@RTY,@S,@SB,@SF,@SI,@SM,@TU,@TY,@US,@W,@YM
I will be testing various bar sizes for each market, ranging from 65 minutes up to daily (1440 minute) bars.
// Bar Intervals Data1: 1440,725,365,245,125,65
The test period will be from 2007 to 2022.
Algo Test Setup – Test Type
I will be using walkforward testing for this analysis, which will eliminate many of the issues associated with over-optimization and curve fitting. Walkforward testing is how I normally test my candidate strategies as part of my Strategy Factory workshop.
Algo Test Setup – Entry Strategy Code
I will be testing 4 primary trading strategies, ones that represent how quite a few people trade. These are basically trend following systems. In addition, I will be testing the reverse of each systems, which will basically be counter-trend type systems.
Using these 8 strategies, I should get a good idea of what works, and what does not work, with the Quick Exit approach.
Here are the entries in Tradestation Easy Language format. Note that the RSI-2 entry also has an exit in it.
If you do not use Tradestation, you’ll have to convert the code to the language of your choice. Tradestation uses Easy Language, which should be pretty easy to translate. If you are interested in Tradestation, my students get really good incentives for signing up with Tradestation (I am not compensated for this): https://kjtradingsystems.com/tradestation.html
//////////////////////////////////////////////////////////////////////////////////////////////////////////////////
// MAIN STRATEGY LOGIC //
// //
//breakout, test 1
If high=highest(high, InputVar3) then buy next bar at market;
If low=lowest(low, InputVar3) then Sellshort next bar at market;
//momentum, test 2
if close crosses above close[InputVar3] then buy next bar at market;
if close crosses below close[InputVar3] then Sellshort next bar at market;
//mov avg cross, test 3
if close crosses above average(close,InputVar3) then buy next bar at market;
if close crosses below average(close,InputVar3) then Sellshort next bar at market;
//RSI 2, test 4
if close> average(close,200) and close<average(close,Inputvar3) and rsi(close,2) crosses below 10 then buy next bar at market;
if close< average(close,200) and close>average(close,Inputvar3) and rsi(close,2)crosses above 90 then Sellshort next bar at market;
if close>average(close,InputVar3) then sell next bar at market;
if close<average(close,InputVar3) then buytocover next bar at market;
//breakout, test 5 (reverse)
If high=highest(high, InputVar3) then Sellshort next bar at market;
If low=lowest(low, InputVar3) then buy next bar at market;
//momentum, test 6 (reverse)
if close crosses above close[InputVar3] then sellshort next bar at market;
if close crosses below close[InputVar3] then buy next bar at market;
//mov avg cross, test 7(reverse)
if close crosses above average(close,InputVar3) then sellshort next bar at market;
if close crosses below average(close,InputVar3) then buy next bar at market;
end;
//RSI 2, test 8(reverse)
if close> average(close,200) and close<average(close,Inputvar3) and rsi(close,2) crosses below 10 then sellshort next bar at market;
if close< average(close,200) and close>average(close,Inputvar3) and rsi(close,2)crosses above 90 then buy next bar at market;
if close>average(close,InputVar3) then buytocover next bar at market;
if close<average(close,InputVar3) then sell next bar at market;
Algo Test Setup – Exit Strategy Code
My whole premise here is that when price “spikes” in your favor, it is a good time to exit. I showed some examples of spikes earlier, and there could be many ways to define these spikes.
Average True Range (ATR) is a great measure of “spikiness.” If the closing price change from one bar to the next is large, an exit based on Average True Range will kick in.
Here is an exit using Average True Range. There will be an input parameter (InputVar2) that I will vary as part of this test.
Note that one case (InputVar2=0) turns off this exit. So when I show results for InputVar2=0, there is no ATR based exit active.
//ATR Based
If InputVar2>0 then begin
If close>close[1]+InputVar2*AvgTrueRange(15) then sell next bar at market;
If close<close[1]-InputVar2*AvgTrueRange(15) then buytocover next bar at market;
end;
Algo Test Results – How I am Analyzing the Data
My testing will consist of running the 8 different entries with a walkforward test using the lookback length (InputVar3 in the code for entries above) as an optimized variable.
For the exit, I am going to run 6 different values of the ATR multiplier, from 0 to 2.5 in steps of 0.5.
Once I get the results, how do I determine what is best? I could sort by the highest Net Profit, but that will ignore drawdowns. I could sort by minimum drawdowns, but that might mean the best trading is no trading (if you take zero trades, you will have zero drawdown!).
So, I am going to use 3 different performance measures, and have a forced ranking system:
Since I have 6 values of the ATR multiplier, I will rank all six cases for each metric, from 1=best to 6=worst. It sounds confusing, but you’ll see it really is not!
Algo Testing – The Solution for Rapid Testing
If you do the math, you will see I am running a LOT of backtests:
54 markets x 6 bar sizes x 8 entries x 6 ATR values x 10 lookback lengths = 155,520 unique backtests
Plus, I am also running multiple walkforward tests.
If you’ve ever backtested before, you’ll quickly realize this is a TON of testing.
Yet I can do it quickly and efficiently, using a software tool for Tradestation called MultiOpt (https://multiopt.net/). It is software written by a programming wiz student of mine, and is ONLY AVAILABLE TO MY STRATEGY FACTORY STUDENTS.
It turns weeks of testing into hours. It is pretty slick, and this software is what allows me to share this neat research with you.
// Symbols Data1: @AD,@BO,@BP,@BRN=105XC,@C,@CC,@CD,@CL,@CT,@DX,@EC,@ED,@ES.D,@ES,@FC,@FDAX,@FESX,@FGBL,@FGBM,@FGBS,@FGBX=108XC,@FSTB=108XC,@FSTU=108XC,@FV,@GC,@HG,@HO,@JY,@KC,@KW,@LB=108XC,@LC,@LH,@MP1,@NG,@NK,@NQ,@O,@OJ,@PA=105NC,@PL,@RB,@RR,@RTY,@S,@SB,@SF,@SI,@SM,@TU,@TY,@US,@W,@YM
I will be testing various bar sizes for each market, ranging from 65 minutes up to daily (1440 minute) bars.
// Bar Intervals Data1: 1440,725,365,245,125,65
The test period will be from 2007 to 2022.
Algo Test Setup – Test Type
I will be using walkforward testing for this analysis, which will eliminate many of the issues associated with over-optimization and curve fitting. Walkforward testing is how I normally test my candidate strategies as part of my Strategy Factory workshop.
Algo Test Setup – Entry Strategy Code
I will be testing 4 primary trading strategies, ones that represent how quite a few people trade. These are basically trend following systems. In addition, I will be testing the reverse of each systems, which will basically be counter-trend type systems.
Using these 8 strategies, I should get a good idea of what works, and what does not work, with the Quick Exit approach.
Here are the entries in Tradestation Easy Language format. Note that the RSI-2 entry also has an exit in it.
If you do not use Tradestation, you’ll have to convert the code to the language of your choice. Tradestation uses Easy Language, which should be pretty easy to translate. If you are interested in Tradestation, my students get really good incentives for signing up with Tradestation (I am not compensated for this): https://kjtradingsystems.com/tradestation.html
//////////////////////////////////////////////////////////////////////////////////////////////////////////////////
// MAIN STRATEGY LOGIC //
// //
//breakout, test 1
If high=highest(high, InputVar3) then buy next bar at market;
If low=lowest(low, InputVar3) then Sellshort next bar at market;
//momentum, test 2
if close crosses above close[InputVar3] then buy next bar at market;
if close crosses below close[InputVar3] then Sellshort next bar at market;
//mov avg cross, test 3
if close crosses above average(close,InputVar3) then buy next bar at market;
if close crosses below average(close,InputVar3) then Sellshort next bar at market;
//RSI 2, test 4
if close> average(close,200) and close<average(close,Inputvar3) and rsi(close,2) crosses below 10 then buy next bar at market;
if close< average(close,200) and close>average(close,Inputvar3) and rsi(close,2)crosses above 90 then Sellshort next bar at market;
if close>average(close,InputVar3) then sell next bar at market;
if close<average(close,InputVar3) then buytocover next bar at market;
//breakout, test 5 (reverse)
If high=highest(high, InputVar3) then Sellshort next bar at market;
If low=lowest(low, InputVar3) then buy next bar at market;
//momentum, test 6 (reverse)
if close crosses above close[InputVar3] then sellshort next bar at market;
if close crosses below close[InputVar3] then buy next bar at market;
//mov avg cross, test 7(reverse)
if close crosses above average(close,InputVar3) then sellshort next bar at market;
if close crosses below average(close,InputVar3) then buy next bar at market;
end;
//RSI 2, test 8(reverse)
if close> average(close,200) and close<average(close,Inputvar3) and rsi(close,2) crosses below 10 then sellshort next bar at market;
if close< average(close,200) and close>average(close,Inputvar3) and rsi(close,2)crosses above 90 then buy next bar at market;
if close>average(close,InputVar3) then buytocover next bar at market;
if close<average(close,InputVar3) then sell next bar at market;
Algo Test Setup – Exit Strategy Code
My whole premise here is that when price “spikes” in your favor, it is a good time to exit. I showed some examples of spikes earlier, and there could be many ways to define these spikes.
Average True Range (ATR) is a great measure of “spikiness.” If the closing price change from one bar to the next is large, an exit based on Average True Range will kick in.
Here is an exit using Average True Range. There will be an input parameter (InputVar2) that I will vary as part of this test.
Note that one case (InputVar2=0) turns off this exit. So when I show results for InputVar2=0, there is no ATR based exit active.
//ATR Based
If InputVar2>0 then begin
If close>close[1]+InputVar2*AvgTrueRange(15) then sell next bar at market;
If close<close[1]-InputVar2*AvgTrueRange(15) then buytocover next bar at market;
end;
Algo Test Results – How I am Analyzing the Data
My testing will consist of running the 8 different entries with a walkforward test using the lookback length (InputVar3 in the code for entries above) as an optimized variable.
For the exit, I am going to run 6 different values of the ATR multiplier, from 0 to 2.5 in steps of 0.5.
Once I get the results, how do I determine what is best? I could sort by the highest Net Profit, but that will ignore drawdowns. I could sort by minimum drawdowns, but that might mean the best trading is no trading (if you take zero trades, you will have zero drawdown!).
So, I am going to use 3 different performance measures, and have a forced ranking system:
- Net Profit
- Profit / Max Drawdown
- Profit / Drawdown Ratio From Monte Carlo Testing (A proprietary measure I teach in my course)
Since I have 6 values of the ATR multiplier, I will rank all six cases for each metric, from 1=best to 6=worst. It sounds confusing, but you’ll see it really is not!
Algo Testing – The Solution for Rapid Testing
If you do the math, you will see I am running a LOT of backtests:
54 markets x 6 bar sizes x 8 entries x 6 ATR values x 10 lookback lengths = 155,520 unique backtests
Plus, I am also running multiple walkforward tests.
If you’ve ever backtested before, you’ll quickly realize this is a TON of testing.
Yet I can do it quickly and efficiently, using a software tool for Tradestation called MultiOpt (https://multiopt.net/). It is software written by a programming wiz student of mine, and is ONLY AVAILABLE TO MY STRATEGY FACTORY STUDENTS.
It turns weeks of testing into hours. It is pretty slick, and this software is what allows me to share this neat research with you.
Results – Quick Exit Based On Average True Range
Here is an example of the evaluation approach, for Entry #1 Net Profit:
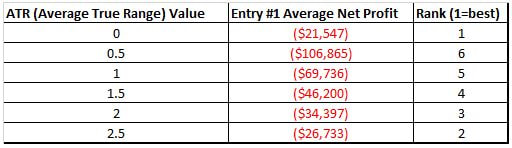
This data says that for Entry #1, using Net Profit as the criteria, that having no ATR exit is best, and having an ATR exit with multiplier of 0.5 is the worst.
In other words, for this particular situation, the “quick exit” is no good!
Without boring you with details, I did the same analysis for all 8 entries, with the 3 aforementioned performance metrics, and here is what I found:
In other words, for this particular situation, the “quick exit” is no good!
Without boring you with details, I did the same analysis for all 8 entries, with the 3 aforementioned performance metrics, and here is what I found:
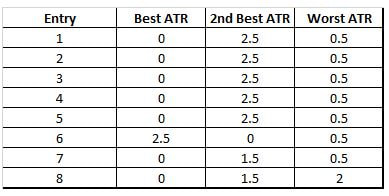
What does this tell us?
1) In almost all cases, for trend following and counter trend entries, not having a “quick exit” is the best route to go
2) The second best option is usually to have a very large “quick exit” – an ATR multiplier of 2.5. I suspect this ATR multiplier is so large that most times it is the same as having no ATR exit
3) The worst case in almost all cases is a small ATR multiplier.
Remember, these results are from 3 different performance metrics – ones that measure net profit or net profit (return) and drawdown simultaneously.
Conclusion - Algo Trading Quick ATR Exit
As appealing as the idea of a quick exit after a volatility spike is, the results of my testing show that such an exit does not improve performance. In short, this type of exit is NOT worth having.
Now, it is possible that the reason this exit performed terribly is because I used Average True Range to measure the volatility. If you read some of my other research, you’ll see that ATR is not so great to use (even though common wisdom says it is great).
Part 2 - Variation on the Algo Trading Quick Exit
Since a quick exit based on Average True Range did not work well, for this test I will try using a Dollar amount for the quick exit.
Think of it this way: if during the next bar my strategy makes $1500, then exit. The $1500 of course is variable, and since different markets have different ranges (a $1500 move in Lean Hogs is huge, but in Crude Oil it is not), I have severe misgivings about a Dollar based quick exit.
But, as in all things I do in algo trading, I’ll test it and see!
Algo Test Setup – Alternate Exit Strategy Code - Tradestation Format
//Dollar Based
If InputVar2>0 then begin
If close>close[1]+InputVar2/bigpointvalue then sell next bar at market;
If close<close[1]-InputVar2/bigpointvalue then buytocover next bar at market;
end;
As with the Average True Range exit, note that a value of 0 for InputVar2 means no exit.
Results – Quick Exit Based On Dollar Amount
Here is an example, for just Entry #1. Note that the top 3 results are pretty similar, with $2,500 being the best.
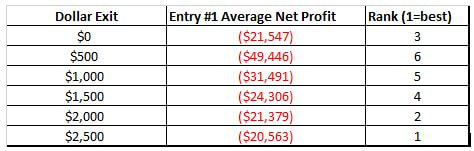
This data says that for Entry #1, using Net Profit as the criteria, that having a $2500 quick exit is best, and having a $500 dollar exit is the worst.
In other words, for this particular situation, the “quick exit” is only good if the dollar value is high!
Without boring you with details, I did the same analysis for all 8 entries, with the 3 performance metrics mentioned earlier (Net Profit, Return/max Drawdown and Monte Carlo Return/Drawdown). Here are the results:
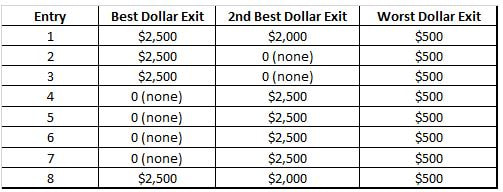
In general using either no quick exit (=0 case) or using a $2500 exit is the best way to go. It is possible that values greater than $2500 could even be better, but I did not test those.
The worst case is always a quick exit of $500. This quick exit might violate the adage “let your profits run.” By using a $500 quick exit, you might be limiting your profits!
The worst case is always a quick exit of $500. This quick exit might violate the adage “let your profits run.” By using a $500 quick exit, you might be limiting your profits!
Conclusion
For my study, a $2500 “quick exit” is potentially a viable way to exit to take advantage of volatility price spikes. At the very least, it is worth testing.
This dollar exit does seem to work better than the ATR based exit of part 1.
This dollar exit does seem to work better than the ATR based exit of part 1.
Closing Thoughts
I’ll admit, I am kind of disappointed. I was hoping the Quick Exit (ATR or Dollar) would show a big improvement over not having such an exit.
Of course, that is why I test – to find out the answer! And many times, the answer unfortunately is “does not work.”
Psychologically, this is still a neat exit to have (exiting with a “windfall” profit is nice, if you can deal with the times the market keeps moving while you are on the sidelines), but the numbers in general do not support this exit as a “must have.”
HTML Comment Box is loading comments...

About The Author: Kevin Davey is an award winning private futures, forex and commodities trader. He has been trading for over 25 years.Three consecutive years, Kevin achieved over 100% annual returns in a real time, real money, year long trading contest, finishing in first or second place each of those years.
Kevin is the author of 5 highly acclaimed books, including "Building Algorithmic Trading Systems: A Trader's Journey From Data Mining to Monte Carlo Simulation to Live Trading" (Wiley 2014). Kevin provides a wealth of trading information at his website: https://www.kjtradingsystems.com
Copyright, Kevin Davey and KJ Trading Systems. All Rights Reserved. Reprint of above article is permitted, as long as the About The Author information is included.