
How to Use Technical Analysis in Swing Trading
Did you know that 95% of traders fail? Swing trading isn't as simple as it may sound, and that's why there is only about 5% that succeed at it. Using analytical strategies and technical analysis to form strategies has a lot to do with it, and this is where many people fall short.
Trading stocks, futures, forex and crypto can be lucrative, but it also requires a mixture of analytical thinking, persistence, a bit of luck at times, and an understanding of the market. If you've never traded before, knowing where to begin can be intimidating, and swing trading is a different type of trading altogether, although it's easier to navigate than most would assume.
You might be considering swing trading stocks as a way to get your feet wet in the markets. This method can be one of the most lucrative forms of trading, but as we mentioned, most that start also fail.
To swing trade successfully, you may want to consider giving technical analysis a try. Here's a guide on how to utilize swing trading by using technical analysis and everything you need to know to ensure functionality within your strategy.
What Is Technical Analysis Exactly?

It's important to note that past performance doesn't indicate future performance. What matters is the data from the past. On a basic level, all you're doing is looking at price and volume and how they interact with each other historically.
You're looking for trends or recurring patterns that occur to see how they interact with the current price and volume of a given asset. You might notice that when the price of a stock goes up, the volume also increases.
Or you might see that when the price of a certain currency pair is declining, the volume also increases. These are all examples of technical analysis. Using this
type of analysis will allow you to better align your trades with the direction that the market is going in.
Overall, using certain technical indicators is something else that can be combined within your strategic approach. Using tools like momentum indicators can help traders to identify possible market reversals and help point out shifts in trading volume. Being able to recognize price patterns and create a routine around your analysis is how this works.
What Is Swing Trading and How Can You Create Analytical Strategies for It
Swing trading involves buying an asset, holding it for several days or even a couple of weeks, and then selling it for a profit or taking a loss. You can create a variety of analytical strategies for swing trading.
It's a popular choice to use Bollinger Bands as well to identify high-risk times to buy or sell a stock. You can also use retracements to identify areas where the price will likely pause or reverse sharply.
If you're swing trading, you may want to use multiple strategies simultaneously. If the price of an asset has been rising steadily for the past few days, that doesn't mean it won't start declining. This is something you will have to pay close attention to and why it's often a good idea to combine strategies.
Identifying Trends With Technical Analysis

Technical analysis overall is a way of analyzing financial markets that involves looking at the past performance of assets, trends, and other factors before making an investment or a certain trading system decision. It helps traders to form a type of algorithmic trading and identify optimal times to buy or sell a stock based on measurable characteristics such as price, volume, and market trends as we've mentioned.
If you want to start applying technical analysis to your trading strategy, you need to know what to look for. There are a few key indicators of a trend, and we're going to explain how they work and why they're so important to your strategy.
Trend Lines
Trend lines connect two points on a chart. It shows the path of price action over a period of time.
Some people also call trend lines "support and resistance" lines, as they help traders identify areas where the price is likely to pause or reverse. Once this is understood you can do more with automated trading.
Support and Resistance
It's basically as it sounds and traders can use this to anticipate where the price is heading next. This is why we mentioned the importance of trading strategies being formed by the direction of the market.
Support refers to a price point where the price is likely to pause or even reverse upward. Resistance refers to more a price point where the price is likely to pause or reverse downward, hence the name.
Retracements
When the price of an asset rises or falls sharply, it's likely to find support at the same price point in the future. If the price of an asset does this, this is a good time to monitor your assets for patterns to help you with forecasting later down the line.
Momentum
When the price today is greater than the price X days ago, the momentum is up, and that is typically a bullish sign. A market headed up, according to momentum, is more likely to keep going up.
Moving Averages
Many people use a 200 bar/day moving average to determine trend. If the price is above the 200 bar average, the trend is up, and vice versa for down trends. The biggest problem with moving averages is that they tend to lag, frequently putting you out of sync with the trend at key turning points.
The Main Types of Indicators to Be Aware Of
There are also a few other swing trading indicators that you could use in your best practice methods. Those main indicators are:
Each of these categories has a few different subcategories that we will go over. It is important to note that you do not need to use all of these indicators in your swing trading strategy.
In fact, many swing traders only use one or two indicators in their strategy. This is something that will become more of a preference with the more experience you gain.
Let's take a look at some of the most useful indicators that you should start applying.
The Relative Strength Index (RSI)
The RSI is a momentum indicator that measures how fast the price of an asset is moving. It can be used to identify overbought and oversold conditions in the market. This is useful to help yourself save time and speed up your trades.
The RSI is calculated using the closing prices of an asset over a certain period. it also ranges from 0 to 100 and how it works is that when it reads above 70, it indicates that an asset is overbought, and if a reading is below 30, that indicates that it is oversold.
If the RSI is overbought, this is a signal to swing traders that the price of the asset may fall soon. If it is oversold, this is a signal that the price of the asset may rise at some point as well.
Bollinger Bands
Bollinger Bands are a technical indicator that consists of three lines. Each of these three lines is drawn on a chart and they represent the changes in prices over a certain period. The three lines that you'll see are:
Overall, Bollinger Bands are more of an indicator that's used to measure volatility in the market and they can often be used to identify overbought and oversold conditions, as well as trend reversals.
MACD
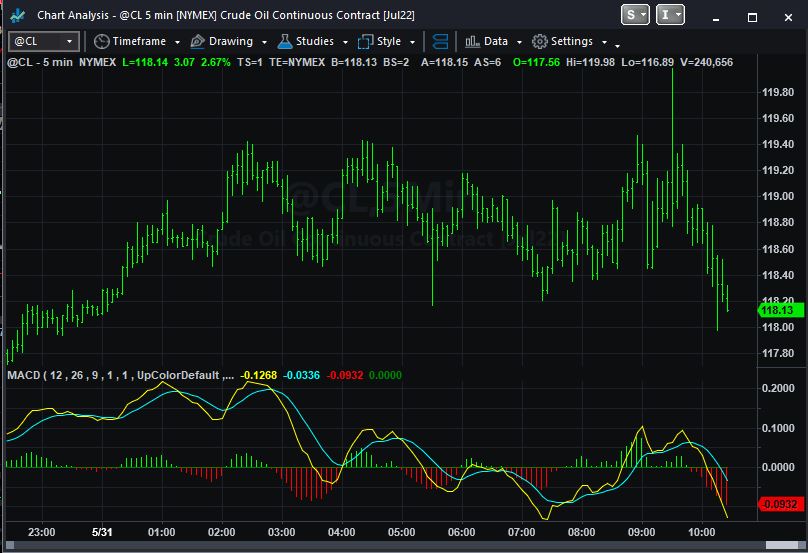
The MACD (Moving Average Convergence Divergence) Indicator is another momentum indicator. The best way to understand it is that it shows the relationship between two moving averages. The MACD consists of two lines: the MACD line and the signal line.
The MACD line is the difference between the 12-period EMA and the 26-period EMA. The signal line however, is a 9-period EMA of the MACD line. This may sound a bit complex but it can be quite simple when you know how to break down the different components of an indicator.
Stochastic Indicators
Stochastic Indicators are momentum indicators that are widely used in the stock market. It's a two-line type of indicator and yes, you can use it on any chart. The lines fluctuate within a range of 0 to 100 and the purpose of this is to help you identify how current pricing compares to the lowest and highest pricing levels over a set period.
It may help you to understand how this indicator's used if you know how its formulation works. Stochastic Indicators are calculated using the following formula:
%K = 100(Current Close - Lowest Low)/(Highest High - Lowest Low)
%D = 3-Period Simple Moving Average of %K
The %K line is usually plotted as a solid line and the %D line is often plotted as a dotted line. When the %K line rises above the %D line, it is a signal that the stock is overbought and when the %K line falls below the %D line, it indicates the opposite.
If you've noticed, each indicator that we have talked about have all been ways to identify points throughout the market. The key to swing trading is waiting for these market shifts and using different graphical methods to properly chart your strategies.
It is important to note that the Stochastic Indicator is not a perfect indicator and there will be times when the stock is overbought or oversold but the price continues to move in that direction. However, this particular indicator can be a useful tool for swing traders to use to make better-informed trading decisions.
- Volume Indicators
- Price Action Indicators
- Trend Following Indicators
- Momentum Indicators
- Volatility Indicators
Each of these categories has a few different subcategories that we will go over. It is important to note that you do not need to use all of these indicators in your swing trading strategy.
In fact, many swing traders only use one or two indicators in their strategy. This is something that will become more of a preference with the more experience you gain.
Let's take a look at some of the most useful indicators that you should start applying.
The Relative Strength Index (RSI)
The RSI is a momentum indicator that measures how fast the price of an asset is moving. It can be used to identify overbought and oversold conditions in the market. This is useful to help yourself save time and speed up your trades.
The RSI is calculated using the closing prices of an asset over a certain period. it also ranges from 0 to 100 and how it works is that when it reads above 70, it indicates that an asset is overbought, and if a reading is below 30, that indicates that it is oversold.
If the RSI is overbought, this is a signal to swing traders that the price of the asset may fall soon. If it is oversold, this is a signal that the price of the asset may rise at some point as well.
Bollinger Bands
Bollinger Bands are a technical indicator that consists of three lines. Each of these three lines is drawn on a chart and they represent the changes in prices over a certain period. The three lines that you'll see are:
- Upper Bollinger Band
- Lower Bollinger Band
- Middle Bollinger Band
Overall, Bollinger Bands are more of an indicator that's used to measure volatility in the market and they can often be used to identify overbought and oversold conditions, as well as trend reversals.
MACD
The MACD (Moving Average Convergence Divergence) Indicator is another momentum indicator. The best way to understand it is that it shows the relationship between two moving averages. The MACD consists of two lines: the MACD line and the signal line.
The MACD line is the difference between the 12-period EMA and the 26-period EMA. The signal line however, is a 9-period EMA of the MACD line. This may sound a bit complex but it can be quite simple when you know how to break down the different components of an indicator.
Stochastic Indicators
Stochastic Indicators are momentum indicators that are widely used in the stock market. It's a two-line type of indicator and yes, you can use it on any chart. The lines fluctuate within a range of 0 to 100 and the purpose of this is to help you identify how current pricing compares to the lowest and highest pricing levels over a set period.
It may help you to understand how this indicator's used if you know how its formulation works. Stochastic Indicators are calculated using the following formula:
%K = 100(Current Close - Lowest Low)/(Highest High - Lowest Low)
%D = 3-Period Simple Moving Average of %K
The %K line is usually plotted as a solid line and the %D line is often plotted as a dotted line. When the %K line rises above the %D line, it is a signal that the stock is overbought and when the %K line falls below the %D line, it indicates the opposite.
If you've noticed, each indicator that we have talked about have all been ways to identify points throughout the market. The key to swing trading is waiting for these market shifts and using different graphical methods to properly chart your strategies.
It is important to note that the Stochastic Indicator is not a perfect indicator and there will be times when the stock is overbought or oversold but the price continues to move in that direction. However, this particular indicator can be a useful tool for swing traders to use to make better-informed trading decisions.
Other Ways to Use Technical Analysis in Your Swing Trading Strategy
You can also use it to identify when the best time is to buy an asset. You can do this by looking at the chart of the asset and seeing when the price is near its lowest point.
You can also use technical analysis to identify when a stock is near its sell-off, which is when the price of the stock is likely to drop. This method can also work to identify when a given asset is near its price peak. The best way to do this is by looking at the chart of the asset and seeing when the price is near its highest point. In short, you're doing one thing for one strategy and the opposite for another.
You can also use technical analysis to identify when a stock is near its sell-off, which is when the price of the stock is likely to drop. This method can also work to identify when a given asset is near its price peak. The best way to do this is by looking at the chart of the asset and seeing when the price is near its highest point. In short, you're doing one thing for one strategy and the opposite for another.
How to Know if Your Swing Trading Strategy Is Working
One of the best ways to know if your swing trading strategy is working is by looking at the volume. If the price of stock continues to rise, but the volume of the stock has decreased, it could indicate that a downtrend is imminent. If a stock keeps declining despite a high volume, it could indicate that the price is likely to fall even lower.
You also want to pay attention to other indicators, such as moving averages. If a given asset has been rising for the past few days, but all three of the indicators you're using are starting to decline, it could mean that the price of the asset is still going to decrease. Most of the indicators you will use are proactive measures to determine when points in the market will drop off or start to rise.
You also want to pay attention to other indicators, such as moving averages. If a given asset has been rising for the past few days, but all three of the indicators you're using are starting to decline, it could mean that the price of the asset is still going to decrease. Most of the indicators you will use are proactive measures to determine when points in the market will drop off or start to rise.
Learn the Tricks of the Trade
Different forms of trading can be difficult to grasp but it doesn't have to be. Swing trading is one of those things that take consistent tracking, properly aligning your trades with the direction of the market, and persistence. By working with KJ Trading Systems you will find an approach that suits you and how you want to run your trading operation.
If you're interested in saving time and learning to create usable and effective trading strategies, check out a workshop today with a Champion Trader; Kevin Davey.
If you're interested in saving time and learning to create usable and effective trading strategies, check out a workshop today with a Champion Trader; Kevin Davey.
HTML Comment Box is loading comments...

About The Author: Kevin Davey is an award winning private futures, forex and commodities trader. He has been trading for over 25 years.Three consecutive years, Kevin achieved over 100% annual returns in a real time, real money, year long trading contest, finishing in first or second place each of those years.
Kevin is the author of 5 highly acclaimed books, including "Building Algorithmic Trading Systems: A Trader's Journey From Data Mining to Monte Carlo Simulation to Live Trading" (Wiley 2014). Kevin provides a wealth of trading information at his website: https://www.kjtradingsystems.com
Copyright, Kevin Davey and KJ Trading Systems. All Rights Reserved. Reprint of above article is permitted, as long as the About The Author information is included.