
As Part of The Strategy Factory Workshop, You Get These 7 Strategies - Full Code, Plain English Rules and Even Tradestation Workspaces!
|
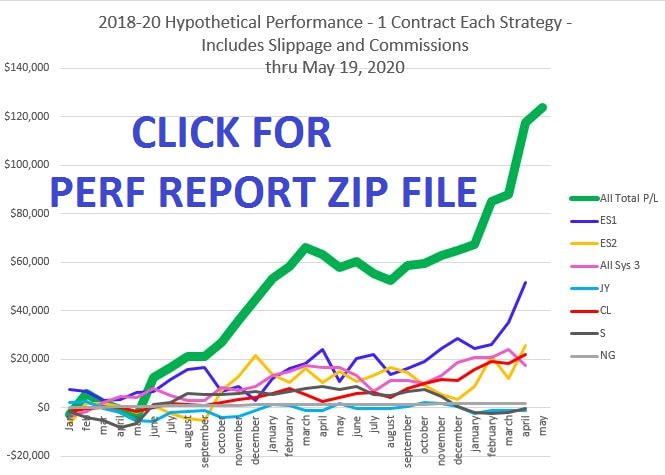
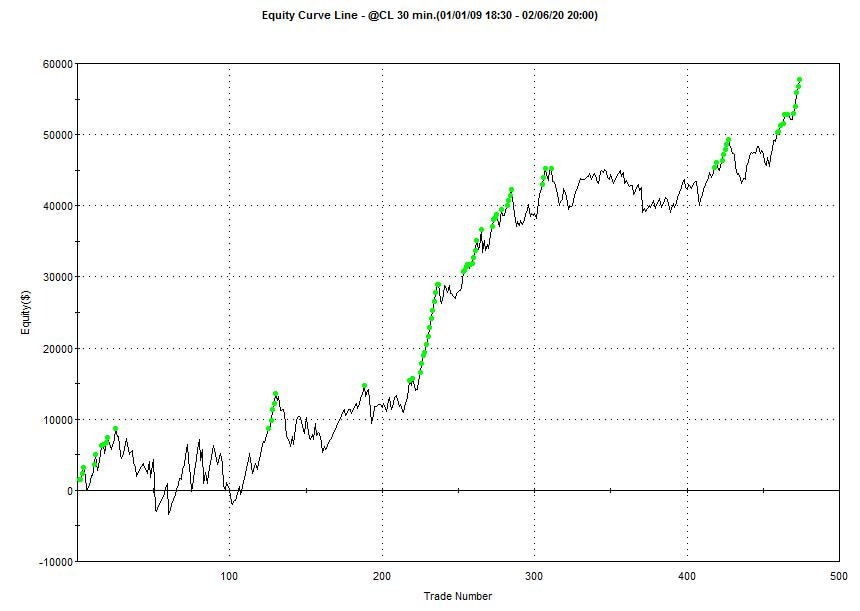
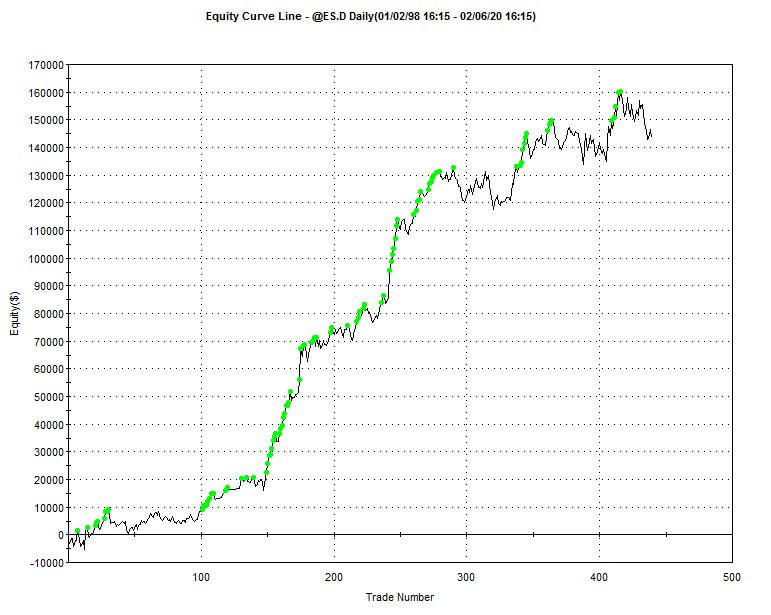
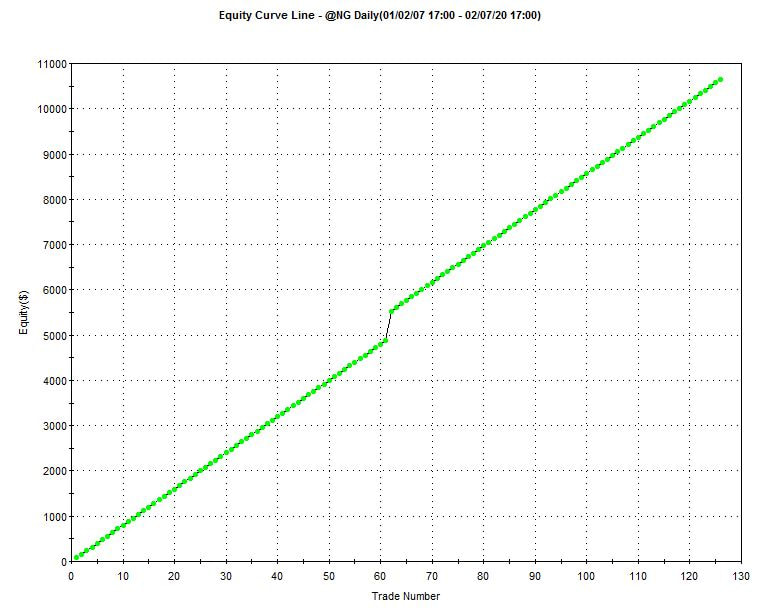
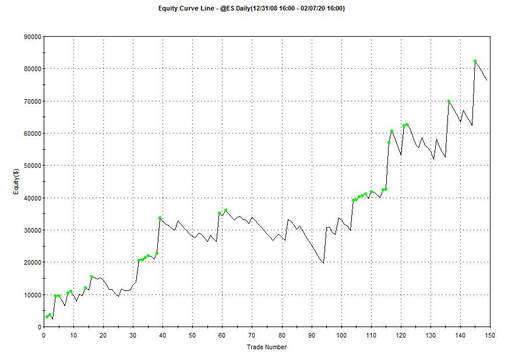
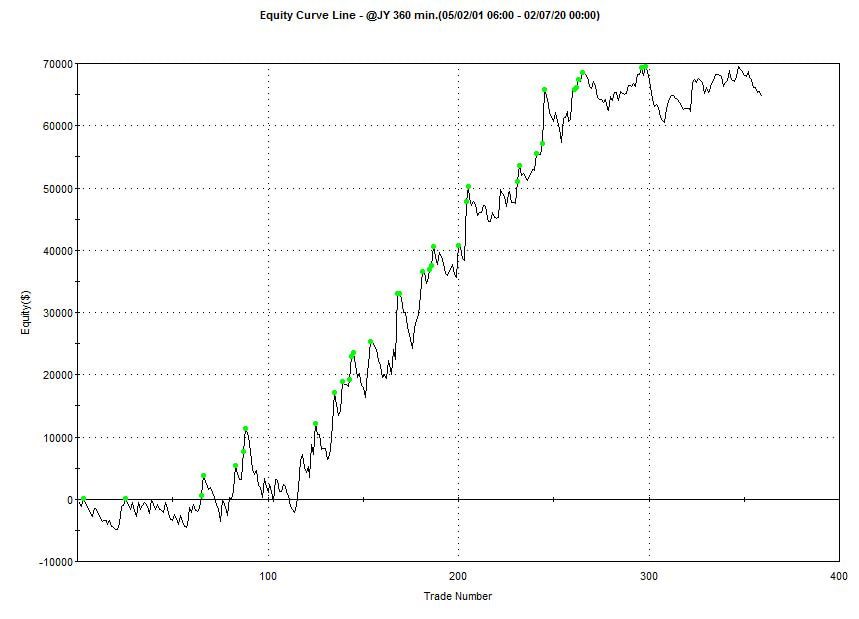
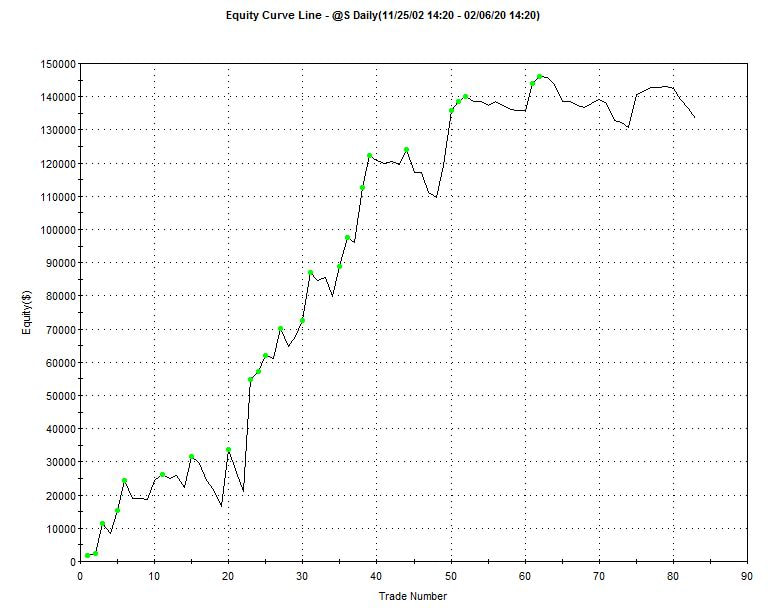
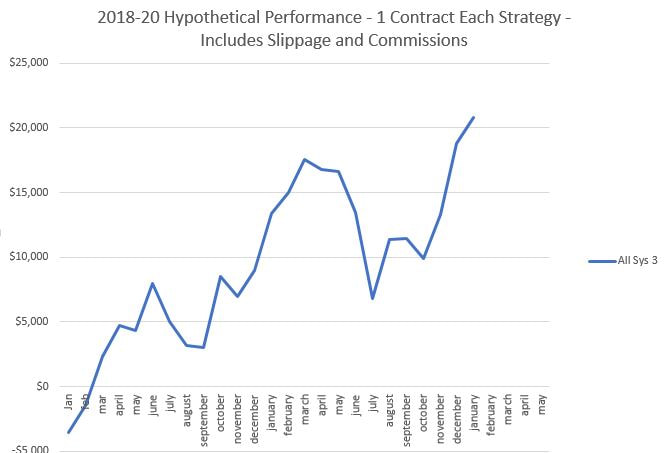
Market: CL (Crude Oil), 30 Minute bars Total Out Of Sample Net Profit: $57,790 Avg Profit Per Trade: $122 # of Trades: 474 Profitable Years (Thru 2019:) 11 of 11 (100%) Treat All Results as Hypothetical Market: ES (mini S&P), Daily bars, Day Session Total Out Of Sample Net Profit: $143,505 Avg Profit Per Trade: $327 # of Trades: 439 Profitable Years (Thru 2019:) 14 of 18 (78%) Treat All Results as Hypothetical Market: NG (Natural Gas), Daily bars Total Out Of Sample Net Profit: $10,605 Avg Profit Per Trade: $85 # of Trades: 126 Profitable Years (Thru 2019:) 13 of 13 (100%) Treat All Results as Hypothetical Market: ES (mini S&P), Daily bars Total Out Of Sample Net Profit: $76,205 Avg Profit Per Trade: $511 # of Trades: 149 Profitable Years (Thru 2019:) 7 of 8 (88%) Treat All Results as Hypothetical Market: JY (Japanese Yen), 360 Minute bars Total Out Of Sample Net Profit: $64,695 Avg Profit Per Trade: $180 # of Trades: 359 Profitable Years (Thru 2019:) 12 of 15 (80%) Treat All Results as Hypothetical Market: S (Soybeans), Daily bars Total Out Of Sample Net Profit: $133,328 Avg Profit Per Trade: $1606 # of Trades: 83 Profitable Years (Thru 2019:) 13 of 17 (76%) Treat All Results as Hypothetical Market: 8 Various (Mostly Ags), Daily bars Total Out Of Sample Net Profit: $20,837 since 2018 # of Trades: 16 per year Profitable Years (Thru 2019:) 2 of 2 Treat All Results as Hypothetical |